
How do you represent visually relationships between people and places that are, I have discovered, unmappable. Only in this last week, under the gun of a deadline thrice removed, did I finally realize that this is what I have been trying to do. Still working on a chapter for a book on Pennsylvania’s Babel of the 18th century, I needed to find a way to describe the dynamic and complex way in which not only Native peoples but Moravians, men and women, communicated and travelled in mid-18th century Pennsylvania. This is an important realization as, within the traditional historiography of this period, both Native and Euro women were just elided. More recently, the focus has turned to Native women in in terms of their agency and mobility. However, what I have been wanting to discuss is how a group of women who were active as missionaries in the Moravian mission field of the 18th century brought with them their expertise from either Europe or the early settlements in New York State and Pennsylvania to effect a translation of culture and knowledge here on the Susquehanna River.
The source materials I have been working with for this chapter are predominantly unpublished, or, if published, reside in 18th century Fraktur imprints. Seemingly straightforward questions, such as birth dates and places, require lengthy investigations of manuscript sources or typed up lists of information taken from the Geburts- und Tauf Register of the Bethlehem communty (also unpublished) or other missions. Spreadsheets of names, dates, places that I have put together over the years have helped in these investigations. And in this quest I was to find out that this accounting of data over the last 25 years would help more than I could have imagined.
I have wanted to map the way in which these women lived and worked (in German I would use the verb “agieren”) in the mid-Atlantic. I wanted to show how their lived lives became an integral part of the warp and weft of the environment of the Pennsylvania backcountry. But to do that I had to also delve into why they were here, what brought them to this place at this time? How did they translate the skills, experiences, concepts of self that had been learned in the Pfalz, Germany, or a village near Oxford, England, or a farm close by the Mohican villages in upstate New York to the banks of the Susquehanna or the Lehigh rivers?
I started to make maps. Firing up my GIS layers, I mapped the missions, I mapped the women, I inserted date ranges. But it still was static. It didn’t show the movements of the women between the missions over time in an effective way (maybe because I am not as skillful at this as my students…) Then, staring at the DH Humanities list from my alma mater King’s College, London, I saw the announcement of palladio in beta out of Stanford. Assuming that this was a happy by-product of the well-known and ground-breaking project “Mapping the Republic of Letters” I decided to “dive in.”
When I first started working on the Moravian women’s memoirs 25 years ago I was surprisingly data driven. I wanted to know who these fascinating and diverse people were. One of the places in Bethlehem that inspired me to work on the Pietist group was the “Gottesacker” with its flat gravestones that are ordered in terms of marital status, age and gender and not by social ranking or racial group. I found the register of the Gottesacker and built a database of all the women who were buried there, found information about their birthplace, dates, brief biographies. When I looked at how data was supposed to be entered into Palladio, I thought this would be a good first project. With the help of my research assistant, Hein Thun, we entered all the exact locations of birth and death in longitude and latitude and then I entered this into the online program. What came out was good. A mapping of places from which the Bethlehem women came in the 18th century, both in terms of a geo-location and also a very basic visualization.


Having had some success with this visualization I wanted to try it with the missions and missionary women. But I couldn’t get it to show what I wanted. I was still too hung up on mappy maps.
It wasn’t until I talked to Andy Famiglietti, one of the Digital Scholarship co-ordinators at Bucknell, that I realized that I had to think of maps that weren’t maps. I had to remove the “geo” from my spatial thinking to visualize these relationships. This was not easy for me; really, really not easy. I had tried working with Gephi before, but it was only once Andy explained to me the fundamental rule of thinking about networks as relationships between two entities (not three, not four) that I understood why my attempts to date had failed. So, modifying the data, stripping it down to the “edges” of people and places, we were able to visualize what I had been looking for and trying to express in my chapter.
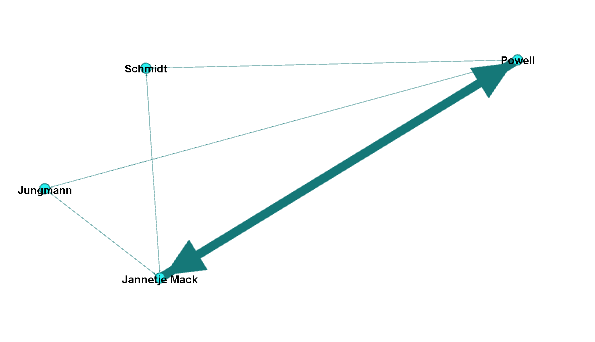
It was truly a “eureka” moment. Yes, it is not the most elegant, or beautifully rendered visualization. But it showed what I wanted it to show, the strength of relationships between these women and their places of agency.
Curious to see how Palladio might represent this same data I fiddled around that night and came up with another, different, visualization of these people and places.

Again, it is not beautiful and I have not fully explored the capacities of Palladio, but it is a beginning. A beginning of mapping without maps, of being able to render visible what has been invisible to date, namely, the strong network of women’s lives in the history of this place.
.
