The primary sources for this study are the Shamokin mission diaries, 1742-1755, which I translated and edited for publication as Cultures at the Susquehanna Confluence: The Diaries of the Moravian Mission to the Iroquois Confederacy, 1745-1755 (Penn State University Press, 2024), part of the Penn State Series on Anabaptist, Moravian and Pietist Studies. This prior work is methodologically foundational: I know this text as my tongue knows the back of my teeth. Every analytical decision described below was made against that intimate knowledge of the German original and its affective register, developed through over ten years of transcription and translation work.
Translation is, as Gayatri Spivak has argued, the most intimate act of reading. To translate the Shamokin diaries was to inhabit their emotional world: to feel the weight of the German word innig (intimate, heartfelt) in contexts of communion and companionship, and to register the shift to ängstlich (anxious, fearful) as colonial pressure mounted after 1753. That intimacy is not incidental to the methodology but rather foundational.
The broader historical and geographical context for the Shamokin mission is established in the monograph Cultures at the Susquehanna Confluence: The Diaries of the Moravian Mission to the Iroquois Confederacy, 1745-1755 (Penn State University Press, 2024). Also my deep research into the later missions on the North Branch, Friedenshütten and Scheschquehannunk (1765-1772), provides the comparative framework for understanding Shamokin’s distinctiveness as a mission place. My paper can be found here: Places of Peace: Moravian Missions on the North Branch of the Susquehanna 1769-1772
Corpus and Segmentation
The analytical corpus behind the paper “Sacred Confluence” consists of the Shamokin mission diaries from 1745 to 1755, the period for which diary records survive. The corpus comprises seventeen discrete sections, each written by a single missionary author, as follows:
Section
Date Range
Author
1
September 13 – November 10, 1745
Martin Mack
2
May 26 – June 28, 1747
Johannes Hagen
3
June 29 – August 2, 1747
Johannes Hagen
4
September 29 – December 31, 1747
Martin Mack
5
January 4 – April 18, 1748
Joseph Powell
6
April 18 – June 28, 1748
Martin Mack
7
November 30, 1748 – January 31, 1749
David Zeisberger
8
April 3 – July 26, 1749
David Zeisberger
9
January 8 – March 5, 1750
Christian Rauch
10
April 14 – June 2, 1753
Bernhard Grube
11
June 4 – July 31, 1753
Bernhard Grube
12
January 11 – July 2, 1754
David Kliest
13
December 19 – 25, 1754
Heinrich Frey and Gottlieb Roesch
14
April 1 – May 31, 1755
Gottfried Rösler
15
June 1 – July 31, 1755
Gottfried Rösler
16
August 1 – September 30, 1755
Gottfried Rösler
17
September – October 1755
Gottfried Rösler
Each section was treated as a discrete unit of analysis, with equal weighting regardless of authorial identity. This decision was methodologically deliberate. Differential weighting based on prior judgments about individual diarists’ theological sophistication or narrative reliability would have introduced the scholar’s interpretive priors into the coding process before the analysis had begun. Equal treatment preserves the integrity of each authorial voice as a documentary witness in its own right.
The corpus has a structural feature that is itself analytically significant: the coverage is uneven. Significant gaps exist between July 1749 and January 1750, and between March 1750 and April 1753. The rupture year of 1755 is documented entirely by a single author, Gottfried Rösler, across four consecutive sections. The gaps in the record are not simply absences. They reflect the precarity of the mission’s documentary practice, the dependence of that practice on the physical presence of individual missionaries, and the increasing difficulty of sustained residence at Shamokin as colonial violence mounted. The silences speak.
The segmentation by author maps directly onto the argument. The emotional arc from Shikellamy’s years of companionship and protection (Mack, Hagen, Powell, 1745-1748), through the middle period of increasing pressure (Zeisberger, Rauch, Grube, Kliest, 1748-1754), to the rupture year dominated by Rösler’s single sustained voice (1755), emerges from the structure of the corpus itself rather than being imposed upon it retrospectively. Seven diarists across seventeen sections: not a single narrative but a succession of individual documentary witnesses, each bounded by the presence and departure of one missionary at the confluence.
Emotion Coding and the Plutchik Framework
The emotion coding was carried out using Robert Plutchik’s wheel of emotions as the governing taxonomy. Plutchik’s model organizes eight primary emotions (joy, trust, fear, surprise, sadness, disgust, anger, anticipation) into a graduated spectrum from intense to mild, with each primary emotion shading into adjacent states: ecstatic to joyful to content; frightened to anxious to uncomfortable, and so on.
This framework was not selected arbitrarily. I had applied Plutchik’s wheel in prior digital humanities work on the Moravian Lebenslauf corpus at the Moravian Lives project (moravianlives.org), a database of over 65,000 Moravian memoirs developed from 2014 onward. That earlier application established that Plutchik’s eight primary categories and their gradations map effectively onto the affective vocabulary of eighteenth-century Moravian German. The framework could accommodate the theological specificity of Moravian emotional language without flattening it. The Shamokin diary coding therefore built on a tested and calibrated instrument rather than starting from scratch.
Human-AI Collaborative Coding
Emotion identification and tagging was carried out collaboratively using Claude (Anthropic, claude.ai, January 2026), a large language model, to identify candidate passages in the diary text where emotion language appeared in proximity to a named place or named person. Each candidate passage was then verified against my own reading of the German original. The philological judgment was mine throughout. Claude operationalized categories I had established; it did not generate them.
I want to be direct about what this means in practice. I brought to the collaboration an editor’s and translator’s knowledge of this specific corpus. Claude brought the capacity to work systematically across a large body of text and to surface patterns that close reading alone might miss. The risk in any AI-assisted coding of historical text is that the tool imposes anachronistic or culturally inappropriate categories on a source that requires specialist knowledge to read accurately. In this case, that risk was mitigated by my verification of every tagged passage against the German original, and by the prior calibration of the Plutchik framework against the Moravian memoir corpus.
This is not a claim that the method is perfect. It is a claim that the method is transparent. The decisions about what counts as fear, or trust, or moral injury in these diaries are interpretive decisions. They were made by a scholar who has spent decades reading eighteenth-century Moravian German, not by an algorithm. The algorithm helped me see the patterns. The interpretation of those patterns is mine.
This collaborative model reflects an emerging best practice in digital humanities work with historical manuscript corpora, one that this study seeks to model explicitly. As I have argued elsewhere in relation to the ethical challenges of AI-assisted work with colonial archives (HAVI grant proposal, 2026), the central question is not whether to use AI but how to ensure that the scholar’s interpretive authority governs the tool’s output, rather than the reverse. The Shamokin methodology is one answer to that question: human philological authority at every decision point, AI as a systematic assistant rather than an autonomous interpreter.
Data Structure and Network Construction
Each tagged passage produced a structured data point consisting of three elements: an emotion coded to Plutchik’s taxonomy, a referent (a named place or named person), and a temporal marker (the year of the diary entry). These triadic data points form the relational dataset from which the network visualizations were constructed.
Four visualizations were developed from this dataset. The Shamokin Diary Emotion Wheel presents the distribution of emotional states across the full corpus and by individual year, allowing direct comparison between the emotional register of 1747-1748 and 1755. The Smithy Network visualizes the people, emotions, and interactions associated with the blacksmith’s forge across the full period and by selected time ranges, showing the transformation of the forge from a space of companionship and productive work to a site of moral injury and trauma. The Susquehanna River Network performs the same analysis for the river, revealing its function as a morally neutral, theodical counterpoint to the ethical entanglements of the forge. The combined Shamokin Diary Network brings people, places, and emotional states together in a single interactive visualization, allowing the relational geography of the mission to be read as a whole.
All four visualizations are interactive, allowing users to filter by time period and by type of relationship or interaction.
Methodological Stakes
This methodology sits at the intersection of philology, translation studies, and digital humanities. It resists two common reductions: the computational approach that processes historical text without philological grounding, and the close reading approach that cannot scale across a multi-year, multi-author manuscript corpus. The combination of Plutchik’s tested taxonomy, annual segmentation, human-AI collaborative coding, and network visualization allows the emotional geography of the Shamokin mission to be reconstructed at a level of granularity that neither approach could achieve alone.
The method also makes a claim about evidence. Emotion language in the Shamokin diaries is not incidental. It is the primary medium through which the diarists processed their experience of place, person, and divine action. To read the diaries without attending to their affective register is to miss their argument. Therefore, a placeography and personography of emotions are not supplementary to the historical analysis. They are its substance.
Finally, this methodology makes a claim about responsibility. To use AI to assist in the analysis of colonial archives is to enter ethically complex territory. The archives themselves are the products of asymmetrical power: European missionaries documenting Indigenous lives, in a language those lives were not lived in, for an institutional readership those lives were not addressed to. To add another layer of algorithmic processing to that already fraught record requires care, transparency, and the constant reassertion of the scholar’s interpretive authority. The method described here is one attempt to exercise that care. But there is much work still to be done.
This week, members of the leadership team of the Institute for Moravian History and World Heritage presented a panel on “Moravians and Place” at the annual meeting of the American Association of Church History in Chicago. The panel was organized by Josh Follweiler, current PhD candidate at Princeton University and most recently Associate Pastor at Central Moravian Church, Bethlehem. Panelists were myself, Paul Peucker and Josh, and the chair and respondent was Craig Atwood. The papers provided a fascinating examination of how Moravians in the 18th and 19th century thought about place, whether as town planners, missionaries, or ministers. The specific places that were examined were Herrnhaag in the Wetterau, near Frankfurt in Germany; the early mission place of Shamokin, at the forks of the Susquehanna; and planned Moravian town congregations in Pennsylvania.
In my presentation, I focussed on the recently published Shamokin Diaries, analyzing the language of the text to build visual models of relationships between people, place and emotion. These visualizations allow us to explore the change in sentiment related to specific places (the river and the smithy) and people over the period the Moravian missionaries were working at the confluence. I reproduce these visualizations and the talk here.
The River as Metaphor and Reality
In 1747, as the Moravian missionary Johannes Hagen was returning up the Susquehanna from a trip to the grist mill at Quittapahilla, he described the river as “no different to look at than a town full of houses, the rocks lie in the water and the water flows criss-cross between them [like a warp and weft]”. Five years earlier, Count Nikolaus von Zinzendorf on his way to the forks of the Susquehanna at Shamokin, Pennsylvania had also described the river in lyrical terms, the “water [was] beautifully transparent, and were it not for smooth rocks in its bed, it would be easily fordable. In crossing, we had therefore to pull up our horses and keep a tight rein.” I begin this investigation of the notion of a sacred confluence with these two quotations from Moravians to set the scene, literally and figuratively, for trying to understand how this group, which in the 18th century was spread across the globe from Greenland to the Caribbean, and from Kazan in Central Asia to Pennsylvania, understood the power of place. For them, did landscapes play a role in the choice of mission in a way that was not only defined by utility and strategic advantage? Did landscapes themselves hold sacred value? And if so, how did this concept differentiate itself from indigenous concepts of sacred landscapes?
Methodology
The River as Metaphor and Reality
In order to address these questions, I have turned to the language of the Shamokin diary. As a philologist, I work with words. As a digital humanist, I use that language as data to recognize patterns and visualize them. As a translator, I know well that translation is ‘the most intimate act of reading’ (Gayatri Spivak). So, with these tools, while transcribing and translating the Moravian mission diaries from Shamokin, Pennsylvania, I was struck by how the mission diarists described the landscape around the confluence (river, islands, bluffs, riffles, riparian buffers) as central to understanding their role. The physical geography of Shamokin constituted a confluence that required constant negotiation, with the forces of nature made manifest in floods and snowstorms, late frosts that destroyed newly planted crops, storms, and even an earthquake. This place shaped a unique mission encounter in which Moravians operated under the Indigenous authority of the Haudenosaunee. This adaptive mission strategy, centred on work rather than worship as primary witness, contrasts sharply with later Moravian missions on the North Branch of the Susquehanna (1765-1772), where mission places were built as intentional communities of worship and work and reveals how place determined religious praxis in colonial contact zones.
This paper explores the relationship between emotion, agency, and topography that emerged at Shamokin through the Moravian mission presence from 1742 to 1755, in the critical years preceding the French and Indian War. Drawing on the recently translated and published mission diaries (Faull, 2024), I examine how Shamokin differed from other Moravian settlements in colonial America. Unlike Bethlehem or Gnadenhütten, which were established as intentional communities, Shamokin existed as what Count Zinzendorf recognized as a spiritually strategic location where Moravians operated under explicitly negotiated Indigenous constraints (Merritt, 2003; Pointer, 2020).
The Moravian presence at Shamokin represented a central part of Zinzendorf’s mission plan for North America, which emphasized strategically practised humility and cultural respect (Atwood, 2004). I will show how this humility and respect was manifested in the mission through the lens of indigenous agency. The physical place directly influenced religious practice, with European hymns sung alongside sweat lodge ceremonies, pastoral visits conducted across the frequently swirling, ice-filled river, and Shikellamy, the Oneida sachem with oversight over Shamokin, finding spiritual and physical refuge in the Moravian loghouse while maintaining Indigenous practices. Through the 1747 formal agreements establishing a blacksmith’s shop, the Moravians created a shared sacred space where work itself became a form of witness.
Building on the work of Jane Merritt, Richard Pointer and Rachel Wheeler that challenge the older historiographical view of Shamokin, where Shamokin was described as a “place of the prince of darkness”, the Moravian mission diarists describe a place of challenge, both physical and spiritual, but also of cultural and spiritual exchange. Similarly, Rachel Wheeler describes Mohican Christianity in New England, which she argues represented an intentional spiritual choice that transformed both Native and non-Native spirituality, claiming that the Moravians succeeded where Congregationalists failed partly because they were “culturally non-aggressive” colonial outsiders who lacked expansionist ambitions. This approach enabled genuine mutual learning and spiritual exchange between missionaries and Native peoples. In his recent study of Moravian theology on the margins, Ben Pietrenka claims that these liminal spaces radically upturned hierarchies of power. Indeed, such ruptures have been described by Katherine Gerbner in her new book “Archival Irruptions” as subversive discourses of power that are documented in the archives and require a radical counterreading of the traditional narratives of mission, race, and colonialization. It is against this backdrop that I investigate today the relations of agency and religion in the marginal place of Shamokin, Pa.
The town of Shamokin had long functioned as a crucial hub in a vast network of Indigenous mobility. The Moravian mission diaries of the 1740s and 50s reveal a constant movement of Indigenous peoples up and down the Susquehanna River: Tuscaroras, Cayugas, Oneidas, Mohawks, Nanticokes, and Lenape peoples are constantly arriving, departing, hunting, and passing through. Thus, Shamokin was not a static settlement but a dynamic crossroads where multiple Native nations intersected with European traders, missionaries, and colonial officials.
The Moravians’ attitude towards Shamokin evolved through contradictory emotions that traced the broader tragedy of Indigenous dispossession in the Susquehanna Valley. Initially, Zinzendorf well understood the importance of the forks of the Susquehanna as a strategic touchpoint with the powerful Haudensaunee Confederacy and its spiritual possibility—a place where their message of salvation could be spread, where communion could be celebrated, where the gospel might take root among multiple Native nations gathered together. Yet this hope coexisted with frustration over a place that never quite became what they envisioned, where missionary efforts yielded limited lasting results, and safety couldn’t be guaranteed.
Shamokin served practical (if ethically challenging) purposes: a place to develop a relationship of trust with the Haudenosaunee, through building a blacksmith’s shop for gun repairs for Indigenous peoples. The diary is replete with references to a working landscape where Indigenous economies intersected with colonial trade networks, though increasingly on terms dictated by land sales and territorial encroachment. Whereas previous European visitors, such as John Bartram on his visit in 1743, described the place of Shamokin as ideal land for settlement, with its “peach trees, plums, excellent grapes,” and also described the Indigenous people of the area as unable to cultivate it for themselves, the Moravians saw the Indigenous population as politically sophisticated, technologically capable, and spiritually discerning, understanding and respecting their reasons for not cultivating the land according to colonial rules as being rooted in resistance to colonization.
The mission diaries reveal the dark reality of such colonial encroachment, evidenced primarily through the chaos of violence and disorder fuelled by alcohol. The diarists record regular drinking & carousing” (9/17/1745), “all night dancing & howling” (11/2/1745) where “Everybody [is] drunk” (6/5/1748, 6/9/1748) with “drunken brawls & fighting” (2/24/1749) causing “Sleepless night for missionaries” (1/11/1749) and culminating in the Penns Creek “Massacre of white neighbors” (10/16/1755) by the Western Delaware who were allied with the French.
The Moravian missionaries at Shamokin thus lived a paradox of witness and persistence amid overwhelming chaos. Between 1747 and 1755, they engaged in relentless physical labor—constructing two mission houses, laying floors, building chimneys, repairing bridges, and erecting a smithy that became central to their relationship with the Indigenous community. Their documentation of measurements, dates, and improvements suggests both immense commitment to their work and an attempt to create order in an environment beyond their control.
The forge operated as more than a blacksmith shop—it was a tool of engagement and a testament to pragmatic adaptation. The missionaries fixed guns, made charcoal, accepted payment in hides and pelts, and deliberately kept cultivation “at the level of the Indigenous economy” rather than imposing European agricultural models. Yet their economy remained perpetually precarious: starvation diets, crops ruined by frost and hail, with chickens and horses stolen or lost.
Yet amid this distress, the Moravians maintained remarkably disciplined spiritual practice. They held communion services, foot-washing ceremonies, and, in the 1750s, lovefeasts requiring sugar and tea, Easter dawn services at the turnip field where Brother Hagen had been buried, and services that ran until 2 a.m. The stark contrast is captured in Christmas observed with lovefeast while chaos reigned outside. Their principled Sabbath observance—refusing to let Indians demand that they work at the forge on those days—led to “astonishing questions” even as it was criticized for interfering with economic needs. One poignant detail reveals both their vulnerability and their peaceful intervention: a brawl “silenced by missionary’s singing.”
By 1755, the mission’s fragile stability collapsed. Advised to flee (advice “disregarded”), threatened with land claims, facing “bloody action by hostile Indians,” they finally witnessed the “massacre of white neighbors” in October. The mission house and forge were offered for sale with no date given—a poignant detail suggesting the uncertainty of when they could actually leave.
The archival evidence clearly shows that the Moravians at Shamokin operated within Indigenous political and cultural frameworks, adapting themselves to Native authority, while simultaneously navigating colonial politics. When Shikellamy held a Nanticoke Council in 1747 to address the issue of two Nanticokes who had been shot with arrows, the Moravians participated by preparing food “which they placed before the council”—thus serving the Indigenous political process rather than directing it. Significantly, when the Nanticokes showed reluctance to listen to Shikellamy, the Moravians attributed this to “not to some essential notion of their race but rather to them being surrounded by traders,” placing blame on colonial disruption rather than on any inferred Indigenous characteristic.
Cultural exchange flowed in multiple directions. In 1757, Moravian visitors to a Shawnee village on the North Branch were invited to a sweat lodge and accepted, afterwards enjoying an evening concert of European chorales and music for strings played on violins provided by the Indians—a remarkable scene of reciprocal hospitality and shared musicality. Medical practices also bridged cultures: on July 10, 1747, several Indians came to Brother Hagen to be bled, reflecting a shared humoral worldview where both Moravian and Indigenous medicine understood the body as a system of flows requiring balance.
Yet the missionaries also practised strategic isolation, maintaining strict “aloofness from traders” who were “strictly kept out of the house.” This wasn’t cultural superiority but a survival strategy in an environment where traders brought the twin scourges of alcohol and violence. The Moravians navigated a careful path: adapting to Indigenous authority and participating in Native cultural life while protecting their mission space from the destabilizing forces of the colonial economy. Their approach recognized that the greatest threats to peaceful coexistence came not from Indigenous peoples but from European traders whose liquor traffic undermined the very communities the Moravians sought to serve.
The smithy at Shamokin was clearly the economic and relational heart of the mission. The Moravians structured its operation to align with Indigenous economic patterns rather than imposing European models. Indians were “kept on the preferred list,” receiving priority service, while payment came in hides and pelts through immediate exchange, avoiding the debt relationships that characterised exploitative trader practices. The forge offered practical services: repairing guns, manufacturing charcoal, and meeting community needs on a self-supporting basis. This economic philosophy extended to their agricultural practices: they explicitly kept “farming activities on the level of Indian economy” and maintained “agricultural enterprises at a minimum.” Rather than establishing a European-style plantation that would signal territorial claims and economic dominance, the Moravians adapted to Indigenous economic patterns, using the smithy as a tool of engagement that served the community without attempting to transform it.
On August 2, 1747, letters from Bethlehem arrived (always a source of joy), but this time with the critical news that agreement had been reached with the Colonial government to build the smithy. Shikellamy calls a council of the Indigenous leaders, which permits Bishop Spangenberg to speak through his letters, composed in Onondaga and signed with his Haudenosaunee name, T’girhitonti. That same evening, the Moravians celebrated their first communion, thus demonstrating that work and sacred life were intertwined. Hagen writes in the diary, “How we felt at this communion with our Lord I cannot describe. It was also important to us because it is the first one here in the wilderness, perhaps as long as the forest has stood.”
But the smithy was much more than a place of work- it was central to the Moravians’ mission at Shamokin, constructed and operated by them. In this interior space, they controlled who could enter and when, and who could have work done and when. According to the agreement with Shikellamy, it was Indigenous agency that decided whether the warriors needed to pay for the work. The space of the smithy, also, demanded a moral position in which the Moravians could not avoid complicity in the repair of arms. Every decision they made demanded a moral choice and left them no space for passivity in the face of conflict.
Looking at the smithy as a fulcrum of emotion and agency, we can view this diagram which us designed to show emotions connected to the smithy over time. For example, if one wants to talk of an emotional register, the smithy in 1755 is a place of impossible choices for Brother Wesa. A place that had once been a space of Shikellamy’s companionship (1747-8) had become a site of trauma (1755) where Wesa is forced to repair the bloodstained weapons of war.
If we perform the same analysis for the Susquehanna River, we can see that the river serves as an antidote to the ethical conflict in the smithy. It belongs to the realm of nature, an open force of nature beyond human control in a pre-existing landscape. It acts independently of human will, flooding, freezing, and flowing. Moravians respond to it but do not control it. It also offers a morally neutral territory, carrying warriors up and downstream. It offers danger through its rocks, riffles, and ice floes. Yet it is also deeply embedded in colonial geography, defining the boundaries of lawful settlement. The river has a social function, too, linking Shamokin with the Wyoming Valley (one of Zinzendorf’s original Heiden Collegia).
But not only are places linked to emotion; so are people. First, references to specific places are accompanied by specific sentiments in the diary narrative (of course, there are multiple diarists, and their reactions to people and places also determine the emotional index).
Interestingly, Bethlehem is always seen as a place of refuge, frequently referred to during this period by those on mission work as “das Kripplein,” the little manger. People are also associated with emotions: Shikellamy is always a friend and protector, and when he dies, his sons, Johan and Logan, inherit his role but are not as intimately involved in the work of the smithy.
The sense of sacred place at Shamokin contrasts sharply with that of the Moravian North Branch mission sites—particularly Friedenshütten (“Huts of Peace”) (1768-1772) and Scheschquehannunk (1769-1772)—both established between Pontiac’s Rebellion and the American Revolution. These later “Places of Peace” were intentional Christian communities led by converts such as Johannes Papunhank (a Munsee religious leader baptised by David Zeisberger). Friedenshütten embodied the Moravian mission vision that had eluded Shamokin: a thriving mission town with substantial infrastructure, agricultural prosperity, and a vibrant liturgical life that earned admiration from colonial officials and Indigenous leaders alike. The community erected impressive buildings, including a meeting house with glass windows and a belfry, produced abundant harvests that fed both residents and countless visitors, and grew from fourteen to forty-seven communion participants. Their sophisticated governance structures, bilingual education, and extraordinary hospitality—extended even when it strained their own resources—demonstrated Indigenous Christian agency and strategic cultural competence. Yet this success contained its own vulnerability. Built on disputed land, caught between competing political pressures, and ultimately forced to abandon everything on May 3, 1772, Friedenshütten revealed the brutal reality that no amount of prosperity, spiritual commitment, or colonial admiration could protect Indigenous peoples from the violence of expansion and the fundamental insecurity of their land rights. Where Shamokin had struggled against chaos, Friedenshütten achieved everything the Moravians envisioned—and still could not survive.
To return to the questions with which I began this presentation: did landscape play a role in the choice of mission in a way that was not only defined by utility and strategic advantage? Did landscapes themselves hold sacred value? And if so, how did this concept differentiate itself from indigenous concepts of sacred landscapes? I would argue that landscape of Shamokin was selected strategically but became sacred though the 8 years of the mission being active there. Shamokin was selected strategically: Shikellamy’s invitation, Six Nations council site, smithy opportunity. But eight years of dwelling transformed it. The missionaries noticed the river’s beauty (“like warp and weft”), tended Brother Hagen’s grave with pre-dawn visits, called their new house “this dear little place” and composed a hymn for it. They left “not without little tear.” Thus landscape accumulated sacredness through relationship, not geography.
BETHLEHEM was a permanent sacred, always positive across all periods. Letters from there “like honey and balsam.” The place they couldn’t stop longing for.
THE RIVER: Theodicy sacred. Sacred when God acted through it – the flood became Noah’s ark, dangerous falls became deliverance sites. Natural danger without moral culpability.
SHAMOKIN: Relational sacred. Sacred through Shikellamy’s daily protection, through communion’s “unspeakable proximity.” But this sacredness evaporated when relationships fractured in 1755.
The emotional geography reveals that the sacred for the Moravians wasn’t fixed in land but in relationships and divine action. How did this understanding differ from Indigenous sacred landscapes? The Shamokin diary shows that both groups navigated the tension between place and the need to be mobile. Therefore, the relationship to place was not simply “fixed” or “portable”. For the Moravians, Christ is portable (they can worship anywhere). However, through the text we can see that their emotions showed a strong longing for Bethlehem, and when crisis arose, it forced a flight to their permanent sacred centre.
For the INDIGENOUS PEOPLES, place was vital to rituals of identity. For example, the Nanticoke reburied their departed’s bones, the islands in the river were places for council fires and decision making, the land and forest and water were places for the hunt and trade. At the same time the indigenous people demonstrate strategic mobility (seasonal migration, dispersal under pressure) and also, most importantly, exercised agency over who could stay, who had to leave Shamokin. The critical difference was that Moravians could leave because Bethlehem remained secure. Indigenous people maintained protocols through displacement because colonial violence destroyed their sacred places.
The Moravians sought a “portable sacred” – Christ present anywhere. But the emotional geography of the Shamokin diary reveals they couldn’t escape place through theology, in that they couldn’t worship safely without Indigenous protection (Shikellamy made devotion possible); they couldn’t resolve moral complicity in one place (the forge), so they fled to another (the river) where suffering could be explained theologically. And finally, they couldn’t stop longing for one specific place (Bethlehem).
Meanwhile, Indigenous people maintained sacred obligations to specific places (returning bones, ritual sites) while strategically adapting to colonial violence – demonstrating not attachment vs. mobility, but agency under impossible circumstances. Colonial violence, not theology or culture, determined who kept their sacred places. The Moravians fled to Bethlehem. Indigenous people were displaced from Shamokin. Both groups’ relationship to landscape was relational, adaptive, and vulnerable – but only one group had a secure sacred center to return to.
Therefore, landscape mattered beyond utility, but it became sacred through dwelling, not through inherent geography. Landscapes held sacred value for the Moravians – but through relationships, divine action, and community, not fixed spiritual power. This differed from Indigenous concepts – but both groups navigated place/mobility more than simple binaries suggest. The emotional geography reveals that vulnerability, not belief, shaped the sacred landscape. And, at least for a while, Indigenous agency determined who could stay.
Lecture delivered at the Dietrich Theater, Tunkhannock, PA on October 15, 2023
Thank you for the invitation to speak today at the Dietrich Theater in Tunkhannock, standing on the traditional lands of the Munsee, Lenapehoking and Susquehannock Indians.
I titled this talk “Places of Peace” and intentionally did not add a question mark. As I will try to show, there were certainly tensions on the North Branch of the Susquehanna River, both in the Moravian Indian villages of Friedenshütten and Scheschquehannunk between the Mahican and Delaware (Unami and Munsee) residents, and with their neighbours, both settlers and Native Americans, and also in outward-facing discussions with the Haudenosaunee to the north, specifically the Cayuga nation’s chief and the Colonial Superintendent of Indian Affairs, Colonel William Johnson. But, since the outbreak of the French and Indian war and the subsequent Pontiac’s Rebellion, the villages were places of relative peace in comparison with the violence and bloodshed that was occurring as a result of increasing racial tensions between the white settlers and ANY Native Americans further down the Susquehanna River.
What I would like to discuss today is how this place – from the mouth of the Lackawanna up to what is now the New York/Pennsylvania border – was briefly a place of relative stability and environmental wealth for groups of displaced Moravian Indians, Mohican, Unami and Munsee speaking, who were caught up in both the religious awakening that swept up and down the Susquehanna River in the 1740s and the redefinition and renegotiation of tribal identities in Native communities in the Susquehanna Valley.
To help me in this work, I draw on my own long involvement with the records of the Moravian Church in the North American missions, in particular the deep research for my forthcoming book on the Shamokin mission which predated these North Branch missions by 10-15 years but which contains some of the same actors. Common themes for that research project and this one include the historical work of scholars such as Jane Merritt on the contribution of women missionaries to the intercultural exchanges in Pennsylvania, my own work on trade and missions in early Pennsylvania; the recent revisioning of this time and place by scholars such as Richard Pointer, in his remarkable “biography” of Papunhank, the Munsee religious leader that was published in 2020. Also vital to my work is Amy Schutt’s important essay on tribal identities in Moravian missions on the North Branch; and, as we end today, Rachel Wheeler and Sarah Eyerly’s reconstructions of the soundscapes of Moravian mission landscapes. Much of this work is based on the deciphering of the archival records of the Moravian Church, held in Bethlehem PA and also available through Gale Cengage online (if you can read archaic German script).
There are also certain central figures that pervade this work:
The Moravian missionary, David Zeisberger
The Munsee “Prophet” (John) Papunhank, baptized into the Moravian Church by Zeisberger
Job Chillaway and his brother Billy, residents and later title holders to the lands of Wyalsuing
John Woolman, a leading Quaker whose work with Papunhank was central to his religious vision
The Moravian missionary couples who worked in Friedenshütten and Scheschquehannunk: Johann and Margeret Jungmann (fluent in Mahican),
Johann and Johanna Schmick (who was fluent in Mahican and wrote a Mahican dictionary)
Johannes and Marie Roth (who was learning Munsee dialect of Delaware)
First, who were the Moravians and why were they establishing missions to the Native Americans of the North East in the Colonial period?
Count Nicholas Ludwig von Zinzendorf was born in Dresden, the capital of Saxony in 1700. Zinzendorf was a descendent of Protestant Austrian nobility and was raised by his grandmother, Henriette Catharine von Gersdorf after his father’s death and his mother’s remarriage. His grandmother, an educated and talented woman, exercised great influence on the politics and pietism of the day. Zinzendorf was educated at Francke’s school in Halle where he first encountered missionaries returning from the Lutheran mission in Tranquebar, India.
During this period in Halle, he most likely heard about emigration to North America, as in 1702 an entrepreneurial German who had lived in Pennsylvania, Daniel Falckner, had met with the leader of the school and discussed subjects as far-ranging as where the other German settlers lived, to what Native Americans ate, how they hunted, how they raised their children and how one might trade and make money. By 1727 over 20,000 Germans had settled in Pennsylvania in search of financial wealth, and religious and political freedom.
Zinzendorf developed a quite unique approach to mission work. For example, Zinzendorf claimed that the refusal of some missionaries from other denominations to mix with the non-Christians, or to live at their level of poverty, was contrary to the spirit of Christ and accordingly, baptisms were to be performed individually and not en masse, that the individual’s path to salvation was charted by means of frequent “speakings” with spiritual Helpers from the same cultural and linguistic background as the candidate, and that each person was a member of a small band of people who came together regularly to discuss their spiritual growth, exchange confidences about their personal problems, encourage and forgive each other, and help each other. Such an individualistic approach toward conversion had both its benefits and drawbacks. The benefits showed themselves in the success of the missions. The drawback was that the number of converted remained small.
In 1742 Zinzendorf travelled to North America and stayed first in Philadelphia and then came up into the Lehigh Valley. From there he made several trips into Indian Country, first to the Mohican village in Shekomeko, Dutchess County NY, then he visited unsuccessfully the Shawnee in the Wyoming Valley, and also he visited Shamokin and met Shikellamy, Madame Montour and Andrew.
The Moravian mission project was just one of many vectors of colonization of Native American religion and lifeways, but arguably, the most well-meaning. Other groups had already proselytized the Native Americans of the North East, such as the Jesuits and the Presbyterians. Some Native Americans (like Madame Montour) were baptized multiple times and some, like the Oneida, Shikellamy had been baptized in his youth but was drawn to the Moraivans, perhaps especially David Zeisberger, and might well have been baptized before his untimely death in December 1748. The Moravian understanding of conversion and baptism required that each individual non-Christian should feel the call to convert within his or her heart because of the model provided by other Moravians (European or Native American) and also the need to repent. This meant that Moravian conversions were small in number, individualized, and yet also more deeply internalized within Native American communities, to the extent that when asked to move within the vicinity of other non-Chrstian Native villages in the aftermath of Pontiac’s War, leaders such as Papunhank refused, citing the difficulty of maintaining their lives of faith when having to live with non-Christians.
The mission at Friedenshütten was the result of years-long negotiation and discussion with both the Colonial authorities and also with Papunhank, the Munsee religious leader who had built up a substantial town at Wyalusing in the 1750s. Born probably in 1705, maybe in upstate New York, Papunhank’s life has been masterfully pieced together by historian Richard Pointer who draws heavily on many different manuscript sources in the Moravian archives. Pointer outlines not only his biography but also the context in which he lived: an incredibly complex world of colonial expansion, Native American negotiation, betrayal, trickery, increasing racial tension, a discovery of faith, renewal, and alliance building. His story is definitely that of the Delaware peoples, as they were displaced and removed, “adopted” and made into rhetorical women and children by the Six Nations. Renouncing alcohol after the death of his father, Papunhank campaigned to ban the trade in rum. He visited the Society of Friends in Philadelphia (especially Anthony Benezet, the abolitionist and author of influential tracts on the shared humanity of both enslaved Africans and colonized Native Americans) and, according to Pointer, possibly met Shikellamy in Shamokin and witnessed how this effective diplomatic and negotiator for the Six Nations managed to effect a delicate balance between his people’s culture and priorities and the rapidly changing landscape of the Colonial period.
Papunhank desired to found his own village, where his rejection of alcohol and his awakened spirituality could determine the rhythm of life. The availability of good hunting and fertile land and access to the waterways that served as the major routes for trade led him in 1752 to settle on land at Wyalusing and build a substantial settlement. But it was not long before the hostilities of the French and Indian War which erupted in 1755 and the Delawares were split in their loyalties between the French and the British.
The fate of the Indian Moravians who had been expelled from New York state in 1744 and had moved to Gnadenhütten on the Mahoning and Nain near Bethlehem has been told many times. The hostilities of Pontiac’s Rebellion and the ensuing attacks on any Native American groups in 1763-4, converted or not, meant that the safest place for them was deemed by the Colonial authorities to be the barracks in Philadelphia. The attacks of the Paxton Boys as they were known on the Conestoga Indians in Lancaster County and then the ensuing march on Philadelphia made it clear that the “Peaceable Kingdom” that William Penn had envisaged was now an impossibility. The perpetrators of the massacre defended their actions in a remonstrance published in 1764, claiming that the violations of the “distressed and bleeding” frontier were an affront to the brethren and relatives of the murdered whites. They also accused the Moravian Indians of Nain of sending messages to the Shawnee living on the Great Island to plot further murders of the white settlers along the Susquehanna River. According to historian Kevin Kenny, the Paxton Boys were not the only ones to suspect that the Moravian Indians of Nain were secretly trading with enemy Indians and supplying them with guns and ammunition. The Assembly’s commissioners also believed that “there is much reason to suspect the said Moravian Indians have also been principally concerned in the late Murders committed near Bethlehem, in the county of Northampton” (Kenny, p. 133) In response to these accusations, in October 1763 restrictions were placed on purchases of gunpowder in Nain, and the commissioners recommended that the Nain Indians be removed to Philadelphia so that their “behavior may be more closely observed.” (ibid.) To this end, on November 8 1763 a party of 127 Indians from the missions of Nain, Wechquetank, Nazareth and Bethlehem set out for Philadelphia.
As I have discussed in another talk, the non-Indian residents of Bethlehem viewed the departure of the Indians, not only from the mission villages but also from within the very choirhouses of Bethlehem with ambivalence. Kate Carté has argued that the removal of the Nain and Wechquetank Indians was something accepted by the Bethlehem non-Indian residents and that they did not fight this decision because they had never seen them as part of their community (Engel, For Religion and Profit, p. 184) And, a few weeks after the Moravian Indians arrived in Philadelphia on November 11, they were greeted by a furious mob ready to murder them. Afraid that the Philadelphia barracks would not protect them from the mob, the Moravian Indians were moved to a former “pestilence house” on Province Island in the Delaware River. And there they stayed for fifteen months. Conditions were terrible in the prison. Disease was rampant. By the end of 1764, 56 of the Indians had died, nearly half of them children.
The fate of the Nain Indians in the Philadelphia barracks was a constant source of concern for the Bethlehem Moravians. Given the political unrest and racial hatred now rampant in the Pennsylvania backcountry, that was spilling into the crowds of the cities of Philadelphia and Lancaster, it was clear that Nain could no longer be the home of Christian Indians. In September of 1764, before even a clear decision had been made as to the fate of the Indians, plans were drawn up to dismantle the buildings. After the leaders of the Indians in the barracks petitioned for their own release, they were permitted to leave the city and arrived on March 22 1765 back in Bethlehem in deep snow. They were allowed to briefly stop for a week at what remained of their old homes. Six of the fourteen houses were sold to individuals in Bethlehem on March 30, (according to Levering, one was the chapel) and then the following day a farewell lovefeast was held and on April 3 the Moravian Indians left Bethlehem for the apparent safety of Papunhank’s village of Wyalusing on the North Branch.
How come these baptized Indians, Delaware and Mohican, were invited to come to the North Branch? According to Pointer, the Muncee prophet’s village was losing its inhabitants in the early 1760s; some no longer wanted to hear his message, some were worried at the violence on the frontier and as close as the Wyoming Valley where Teedyuscung’s village had been attacked. At this point of crisis, the Moravian missionary David Zeisberger turned up in Papunhank’s village and accepted his invitation to preach. This fortuitous appearance in 1763 led to Papunhank inviting the Moravians to send a missionary to the upper North Branch; also Papunhank requested that Zeisberger baptize him into the Moravian Church. Upon baptism, he received the name, Johannes. Now a Moravian and also still the leader of his village he also recognized the threat that his people were under and for this reason joined the Nain Indians in the Philadelphia Barracks. Negotiating with the Six Nations and also the Colonial authorities, Johannes Papunhank should also be credited with arranging the removal of the remainder of the Nain Indians to Wyalusing. According to Pointer, Papunhank assumed the leadership of this new Moravian community in June 1765, preaching in the Muncee dialect of the Lenape language and also, it is thought, able to communicate with the Mohican Moravians due to his time at the Philadelphia Barracks.
The village that became known as Friedenshütten was built in 1766 in a position closer to the river than Papanhunk’s Wyalusing. The mission diary reveals the day-to-day activities that sustained the community both physically and spiritually. From its beginnings in the spring of 1765, when food was scarce, to its dissolution in the summer of 1772, the town supported itself with its gardens of produce, and seasonal hunting and shad fishing. It hosted numerous parties of visiting Indian nations, some very large and very hungry, many coming for political parley, some coming to visit their family members who had converted. Reading the mission diaries that still exist only in manuscript form, a picture emerges of a vibrant community with a multi-lingual school, a Gemeinhaus (church) complete with oil paintings and a bell, log houses with glass windows, bark houses for those who preferred them, fertile kitchen gardens, and canoes tied up along the river bank.
The numbers in this community kept growing. By the end of 1765 the number was 146, by the end of 1766, 172, and by the end of 1767, 185. The population was made up of almost a third of non-baptized Native Americans, Delaware, Mohican, and also visitors from the Nanticoke, Tuscaroras, and the Cayuga, under whose oversight the lands in Wyalusing fell. Disputes did occasionally arise about the language of worship in Friedenshütten, with the Lenape speakers feeling as though they were at a disadvantage with the preponderance of services being held in Mohican.
And perhaps for that reason in 1769 a delegation of Delaware Moravians discussed the transfer of their members to the already existing village of Schih-shi-quan-nink (a Delaware name meaning a rattle made of a tortoise shell) about 13 miles upriver (or 3.5 hours on a good day). As Amy Schutt has discussed in her work on tribal identities on the Upper Susquehanna, the possible separation of the two congregations into their linguistic groupings in fact went against the Moravian mission philosophy of converted Indians seeing themselves as “one people.” However, the separation into two congregations helped relations between the two groups.
Schechschequanunk was a smaller mission village, numbering only 53 individuals, most of whom were not communicant members, and up to half of whom were not baptized. The geographical location of the village, over 20 miles closer to the Munsee settlements on the Chemung River, meant that it attracted frequent visitors from there, many of whom were relatives of those living in the Moravian village. Some visits were also from the extended family of the Montours, especially the granddaughter of Madame Montour, Esther. The picture of “Queen” Esther that emerges from the mission diaries is not of the bloody avenger of the Wyoming Valley but rather of a leader of the Munsee at a time of political turmoil, colonial negotiation and eventually, with the 1768 Treaty of Fort Stanwix, the prospect of imminent displacement of Native Americans, Christian or not, to lands either under the oversight of the Cayuga (today’s Ithaca, NY) or further west.
Regardless of the threat of imminent removal (surveying of the lands began in June 1769) in both communities, the inhabitants sustained themselves according to the hunting and agricultural traditions of their cultures. There are frequent mentions of the hunting parties coming back with deer, bear and elk meat; but also of the interdiction of hunting on Sundays and the abolition of the celebration of the “bison” or magic hunting medicine ritual in October 1769. The communities are both plagued by wolves who attack livestock repeatedly and thus necessitate the building of a fence around the Friedenshütten village. In March, the inhabitants (women) would leave for the sugar camps where maple sap was tapped and boiled day and night. Corn was planted in late May, when shad were also fished for. Schoolbooks for English spelling were distributed, and the children were reported to be eager learners, and a new schoolhouse was erected to hold the growing population in Freidenshütten. Johannes Roth would bring communicant members of Scheschquinunk down to Friedenshütten for Communion and Easter celebrations.
But in amongst all this activity directed towards building a secure and sustainable settlement, the Moravian Indians were frequently reminded of the insecurity of their right to be on this land. Job Chillaway had filed a legal claim to the lands with the Colonial authorities; Chief Gagohunt of the Cayuga was encouraging the Delaware to move north out of Pennsylvania; David Zeisberger was heeding the invitation of other Delaware chiefs to move west into Ohio country, where the precarity of the property rights in Wyalusing would be unimportant. Johannes Papunhank was however committed to staying put.
Then in September 1771 out of seemingly nowhere, Job Chilloway and others brought accusations of witchcraft against Johannes Panpunhank. This was the final straw in the fight over the land and rights, and although in October chiefs from the Conoy, Nanticoke, Minisink, and Cayuga all refuted the lies told about Papunhank’s sorcery, the distrust stuck. Three weeks later the moving plan to Ohio country was announced which was to be completed by the end of May 1772. Chief Netawatwees of the Delaware council at Gekelemukpechünk had received reports that the way in which the Indians at Wyalusing could live as both Christians and Indians was good and therefore invited them to come west. The message was delivered through Delaware leader Wangomen and then through another leader, Killbuck.
As the 19th-century historian of the Moravian Church William Reichel writes, “The order for the survey at Wyalusing in favour of Job Cilloway is dated the 20th of May, 1772.” The survey was made by John Lukens, Surveyor General. 16th Sept 1773. As we can see from this beautiful digitally restored image of the original survey, completed by Bob Lissa here in Tunkhannock and donated by David Buck, the land covered 623 acres and began on the eastern side of the North Branch at the mouth of the Wyalusing Creek, extended up the side of the creek 139 perches and then over and back to the river. It was part of the Proprietories “Manor of Pomfret” but was called Dundee Manor. The price was 784 pounds.
Why should we be concerned about this history today?
First, this history of complexity and multi-layered identities compounded by place is still with us today; in the place names, the landscapes, the environment that survives from nearly three hundred years ago. As you know, progress towards restoring the environmental health of the river is being made with the help of DCNR and other non-governmental bodies: dams are being removed and fish ladders are being built to allow for the shad to return. New state parks along the river are being created (Vosburg Neck and PA Highlands – last site of Susquehannock village down in York County).
Also scholars are using the internet to open up new public-facing research. Indigenous artists, filmmakers, musicians, are writing this history from their perspective for the audience of today. An example is this powerful retelling of the Conestoga Indian massacre.
Other recent public-facing work that focuses on the links between contemporary Native American populations and this history of peaceful coexistence can be found in the work of Rachel Wheeler and Sarah Eyerly (https://oireader.wm.edu/open_wmq/singing-box-331/).
They write of this project: “Reading more deeply in the mission records made clear that these hymns were a significant element of congregational life in Mohican-Moravian communities such as Shekomeko, New York, and Gnadenhütten, Pennsylvania, in the mid-eighteenth century. They were sung to and by the sick and the dying. They were sung at gravesides. They were sung by men while hunting. They were sung at communal feasts. They were sung for visitors and when traveling to other communities, both Native and European American. They were sung to bring comfort, to call spiritual power, and to create and fortify community.1 And as written documents, the hymnbooks have become important cultural and linguistic records, silently preserving this tradition of Mohican-Moravian hymnody for more than 250 years. As material objects, the hymnbooks in Box 331 are an important, but limited, representation of what was once a living, aural tradition of hymn singing.”
Careful historical research allows us to reconnect and rework the past into the present. Again, Eyerly and Wheeler have worked with the Stockbridge Mohican Munsee population to “resound the compositions of Josua” so we may listen to the past. And in fact today in Nazareth, Dr Eyerly is giving the Zug lecture at the Moravian Historical Society on her book Singing in the Wilderness which includes a collective singing of Moravian hymns in multiple languages. Don’t worry, I won’t ask you to do that!
Conclusion
I conclude my talk today on places of peace in amongst daily reports of war from Ukraine and most recently from Israel and Palestine. One could say that both of these conflicts have at their core claims to land, whose claims predate whose, and who has a right to live on which lands. As one political scientist has recently said in relation to the issue of economic development in the Global South, without clear title to land, no one will or can invest in building industries and infrastructure. This problem is at the root of economic underdevelopment in countries like Haiti. And indeed one can say the same for the desire for economic development here in Colonial Pennsylvania.
The survey map I show here, also digitally restored thanks to Bob Lissa here in Tunkhannock, is from a collection published by the State of Pennsylvania in 1895 that brought together as many of the land surveys from the Colonial period that had survived a fire in the state printing shop. The volume is entitled Draughts of the Proprietaries Manors. About ten years ago I was handed a copy of this volume with its cover tattered, some pages missing, others covered in river silt from the 1972 flood after Hurricane Agnes inundated the Susquehanna Valley. The donor told me to take it and make good use of it as he knew that I worked on the history of the Susquehanna River. For a long time, the maps lay on the kitchen table of a colleague of mine, waiting for him to help to locate the places on these beautiful drafts on a map of Pennsylvania today. Well, he never quite got around to it. So I showed the volume to another friend, Dave Buck, and, once, thanks to Dave, Bob’s daughter Alianna had done her digital magic, we could work with digitized printouts of the maps. So together we poured over the maps, trying to work out where each Manor might lie. Dave had been trained as a surveyor so he pulled out a pencil and started making calculations about rods, and perches, and chains (which was all quite foreign to me) and turned the maps this way and that to try to make them fit. But they just wouldn’t. So I did some digging around in some databases and found a very helpful article about surveying in early Pennsylvania that confirmed our fears. Some of these terrains were just so hard to traverse, let alone lay down chains to measure, that the surveyor just made it up. Ugh!
The reason I bring this up is that the non-Native or non-indigenous notion of land ownership is predicated on surveys and measurements and limits and boundaries that give us “rights” over that area. But if those boundaries are fictions then what happens? Wyalusing and Friedenshütten were abandoned because the land on which they stood had been “sold” or signed over by multiple agents; the Proprietaries, the Six Nations, the Chilloways and Johann Papunhank. The places of peace that were for a short time here on the North Branch became sites of contention. When the Moravian Indians left Friedenhütten for Ohio country, they tolled the chapel bell as they floated the canoes down the river until they turned the bend in the river below Sugar Run and lost sight of their homes at the Huts of Peace.
While recent scholarship has focused on knowledge transfer from African cultures to the Americas concerning inter alia rice production (see Judith Carney, Black Rice) there has to date been little work that traces the links between the technology of iron production in West Africa and the small Colonial iron forges of the mid-Atlantic region. This paper asks the question about the connection between labor practices in the nascent Colonial iron industry, enslaved peoples of African descent, and the networks of itinerant (Euro- and African-American) Moravian preachers in the mid-Atlantic area in the mid-18th century.
Using the methodologies of archival research, GIS mapping and network theory, this paper reveals the relationships between enslaved African populations of the Delaware Valley, iron production, and the organization of African American congregations in Philadelphia and New York, and attempts to trace the way in which these populations were agents of material and spiritual change for peoples of African descent in the Colonial mid-Atlantic
There are two beginnings to this paper. One lies in a manuscript memoir I found in the Moravian archives in Bethlehem about 25 years ago that was written by a 20 year old Igbo man who gave his name as Ofodobendo Wooma. The first line caught me: “I, Andrew the Moor, was born in Ibo land in the unknown part of Africa and was circumcised according to the custom of my nation when I was eight days old. My name was Ofodobendo Wooma.”
At that time, I carried out extensive research into the history of West Africa, especially Igboland, to try to understand the context into which I could place this unique document. At that time I was also working on the volume that would become “Moravian Women’s Memoirs” and had already found, transcribed, and translated Magdalene’s memoir, written/dictated by the woman from West Africa who would become Andrew’s wife in 1762. The discovery and subsequent discussion in print of that document invited me into the Atlantic world of the 18th century through African eyes. My article on this memoir and that of Ofodobendo’s later wife, Magdalene, also from West Africa, placed the life writings of these two enslaved Africans firmly within the genre of the slave narrative and traced how Ofodobendo signified (to use Henry Louis Gates’ term) his life in the tropes of the Christian conversion narrative. That interpretive path led me into an examination of that other very famous Igbo life narrative, Olaudah Equiano, the authenticity of which has been most famously challenged by Vincent Carretta. Even prior to Caretta’s work, I had noted with interest that the first chapter of that work echoed or actually quoted Anthony Benezet’s description of the coast and inland of West Africa in his widely read abolitionist work. Where I wondered had Benezet learned about West Africa? From the Africans on the quayside in Philadelphia? From his daughters who lived in Bethlehem as members of the Single SIsters Choir and who lived with Magdalene? And as I began to dig deeper it became more and more clear that the networks of the Colonial period between Quakers, Africans, Moravians, were strong and influential.
The story of Andrew/York/Ofodobendo Wooma is an exciting find. Although the exact date of composition of his memoir is not known, it breaks off after his baptism in 1746, which would mean that he may well have told his life story at the age of 17. His childhood memories are still fresh, telling of how, at the age of 8 he was exchanged for two goats by his brother, and then sold and resold many times before he was transported on a slave ship to Antigua, sold to a captain from New York, sold again and then again. At the age of about 12, Ofodobendo–now named “York”– was purchased by Thomas Noble, a wealthy merchant in New York with whom the Moravians were well acquainted and with whom members of the congregation who were traveling between Europe and North America would stay. This is of course the New York of the infamous “Slave Rebellion” and one wonders, when York describes his life running the streets, how many of the enslaved Africans he met. However, York is deeply affected by the faith and love of the Moravians in New York City and begs to be allowed to go to Bethlehem and be baptized. And then, after numerous entreaties and twists of fate and circumstance, he ends up as the property of Spangenberg in 1746 and is accepted into the congregation in Bethlehem.
Andrew’s baptism was the first of an African by the Moravians in Pennsylvania. The fact of his being the first such fruit meant that a description and indeed transcription of his baptism was sent to Herrnhut. On February 4, 1746, Spangenberg (his owner) opens the ceremony with these words: “Was der liebe Heiland noch weiter unter uns thut, davor sind wir herzlich gebeugt. Er lässt uns die Freude haben , einen schwarzen unter uns zu sehen, den Er ins weisse Kleid will einkleiden.“
We are humbly prostrate before the works of the dear Saviour among us. He has given us the joy of seeing a Black man among us, whom He wants to dress in white robes.”
Spangenberg then goes on to ask whether Andrew wishes to be baptized and performs the rite of exorcism and then baptism
Frage: Is this yet the Desire of thy Heart to be baptized in the Name of Jesus Christ?
York gab Antwort. Yes.
Frage. Wilt thou be saved by that Blood which he has shed on the Cross?
Antwort yes
Frage, wilt thou be ruled by our Saviour and follow his Steps?
Antw. Yes.
Now our blessed Saviour is so gracious and loving to Sinners that whoever will be helpd, and wants to be set free from Satan and all his Power, such a one may be free in the Name of Jesus.
Ges. O Jesu Christ all Praise to thee
Die Gemeine stund auf u. Br. Joseph trat zum Täufling und sprach:
In the Name of our Lord and Master Jesus Christ who has purchased thee with his Blood, that thou dost not belong to the Devil and the World. But thou art his’n. In this pow’rful Name I command all/// the evil Powers to depart from thee (and leave thy heart to be his Temple and Habitation) and in His name thy Sins are Forgiven unto thee
Why was there such joy to see Andrew, the Black man in the white baptismal robes? Why was this account so carefully transcribed and sent to Herrnhut to Zinzendorf? Most obviously, Andrew’s baptism was a milestone in the success of the Bethlehem congregation in fulfilling its mission to proselytize to the enslaved and indigenous populations of North America. Andrew’s desire to join the Moravian congregation was the direct result of hearing the preachings of Awakened ministers, such as George Whitefield, and lay people in New York. But, as I have argued elsewhere, Andrew may well have had his own reasons for wishing to join the Moravians.
Andrew may well have been the Erstling, but he was not the only African to join the Bethlehem and Nazareth communities.
And here we come to the second beginning of this paper. About two years ago I was asked to give an interview to the Moravian Historical Society on Andrew as a new exhibition was being mounted on “Other Voices” in the Moravian settlements of Bethlehem and Nazareth, and Andrew was to be featured as a representative of the enslaved and free Africans and people of African descent in the colonial period. So I looked into the Moravian Archives again for documents about enslaved people and came across a travel diary by Brother Christian Froehlich which recounted his visit to the “Negroes of Brunswick and Long and Staaten Island in February and March 1752. ”
The Moravians had a mission not only to the Native Americans of Pennsylvania and New York but also to the enslaved peoples of the mid-Atlantic. Prominent in this mission was Christian Froehlich, an itinerant preacher, whose “Plan” it was to visit the enslaved Africans who were living on the Eastern seaboard, from the plantations of Virginia’s Tobacco Coast up through Maryland, New Jersey, Pennsylvania, and New York. In the northern states, many enslaved Africans worked in the forges of Colonial America’s early iron industry, where the iron ore in the hills was extracted and forged into pig iron for export back to England.
Froehlich’s earlier travel journals of his preaching trips to the enslaved peoples of the mid-Atlantic reveal many things: the frequent antipathy and suspicion in the south towards the very goal of the Moravian itinerant preachers along the King’s Waggon Road; the logistical difficulties that needed to be surmounted ; passes that needed to be obtained from the local justices; permission to meet with the enslaved peoples on the plantations or foundries; and fortitude and patience to traverse enormous physical distances, crossing rivers, swamps, and the Chesapeake Bay. These experiences I had already encountered in an earlier 1747 travel diary in which he described his attempt to visit the enslaved peoples on the tobacco plantations on the western shore of the Chesapeake Bay. that had been the focus of a DH class here at Bucknell.
This 1752 document, however, described Froehlich’s visit to the enslaved Africans of New Jersey and New York, a subject that within Moravian studies has hardly been touched at all. Where there are studies of race and religion, they are of the South and rarely mention the populations of Africans living in the mid-Atlantic. Froehlich’s first stop on his journey is to the “Eisen Schmelze” or iron foundry near Bethlehem, the Durham furnace, owned by Mr Wiliam Allen. He describes his meetings with Africans working in the iron industry. He writes: That evening I came to the Iron Forge. It was night. I saw one of the Negroes who brought me to the overseer. He accepted me in all friendliness. He told me that Master Ellen (William Allen) had spoken to him about the Negro Boston and that he wanted to be baptized. He gave him a good report and said he was worthy. He was looking forward to becoming a Christian. Yes, much more than the so-called Christians. He could trust them all. He had Boston brought to him. He was happy to see me. When I told him that he should be baptized he was beside himself. After supper, I visited the Negroes in their house. I told them something about the dear Lamb and how much he loved also the hearts of the Black people, and that He had spilt his Blood for them also. They were very quiet and attentive and asked me to visit them more and hold an assembly for them. They said they were poor Negroes and nobody asked after them much, and about the welfare of their poor souls. I could do nothing but promise them to visit them more often. But I first had to let their masters know. They said they thought their masters would have nothing against it, if they improved themselves, so I commended them to the little Lamb and laid myself happy down to sleep.
From there Froehlich travels into New Jersey to several other foundries to speak to the Black iron workers, then on to New York, Long Island, Staaten Island to speak to the enslaved peoples who were owned by the Van der Bilt’s and the Van Flecks.
So why was Froehlich’s first stop at the Durham Foundry to discuss the baptism of Baston? I wanted to find out more about this man, so I began to work my way through the baptismal records in the archives for the first 60 years of the community.
According to his memoir and also the baptismal register, Baston or Boston was born in approximately 1715 in Santa Crux, Guinea and was sold at around the age of 13 by his own people to slavers. At that age he endured the Middle Passage with about 300 of his people and was brought to Charlestown in South Carolina. There, according to his memoir, he was bought by a ship’s captain because of his being so handsome and taken to England the year that George II ascended the throne (1727). In 1732 he came back across the Atlantic to Monserrat in the West Indies where he was sold to an American and brought to Durham Furnace in Pennsylvania. It was here, as the property of William Allen, that he married Hannah, the property of the Ysselstein family who had just moved to Bethlehem. This marriage was difficult not least because Boston could see Hannah only when on the weekend he could walk the eight miles from the furnace to Bethlehem to see Hanna. However they had a son, Daniel. Baston was moved by Allen to Maryland to work in a furnace there, but was returned to the Delaware Valley once Allen met Hannah and the child.
So this was the reason Christian Froehlich was visiting the Durham Furnace. Baston, having visited Bethlehem several times, wanted to be baptized. Froehlich was securing his owner’s permission for baptism, which then happened on May 16, 1752 a few months after Froehlich’s visit.
Baston is baptized as Joseph and, after the congregation collects 50 pounds to buy him from William Allen, he is able to join his wife in the congregation. Hannah and Joseph have seven children, none of whom have children. Hannah is bought by the congregation and they require Joseph to pay the interest on the loan for her freedom. If he doesn’t she will be returned to the Ysselsteins.
So what about Andrew? At the end of his memoir the choir helper mentions the fact that he likes to speak with his countrymen about being saved. What however is not mentioned is that at the synod in Germantown in 1747 Andrew petitioned to be Christian Froehlich’s assistant in his ministry to the Africans of the Delaware Valley. In fact, according to the Single Brethren’s Diary Andrew not only visits the slaves in the iron forges of the Delaware Valley, he also goes to Philadelphia in 1749 where he works as the Spiritual Helper of the Black population there.
What effect might Andrew’s ministry have had on both Baston working in the Durham Forge and the other Africans in Philadelphia? According to John Catron, Andrew made numerous trips to Philadelphia between 1748 and 1753, some with either Christian Froehlich or with Brother Boemper and some alone, at times for up to four months. His work in the city seems to have had some effect on the Black population. 25 Black men and women appear in the Philadelphia Moravian church registers at that time, only six of whom were enslaved peoples. The Black members identify themselves as “Igbo”, or from “Guinea” or from St Croix.
That Andrew would have attracted Igbo to the church is not surprising as in later records it is shown that he preferred to keep networks of his “Landsleute” alive and would use Igbo to speak to other Igbo in the Delaware Valley and Philadelphia. In fact, in 1762 he asks to leave Bethlehem so that he can go to these countrymen and live.
African-Iron Forges
In the scholarly literature on the colonial mid-Atlantic iron industry it has been claimed that the Underground railroad, that knowledge network of safe places on the road up North to freedom, would frequently pass by iron forges because of the large African labor force that was known to be working there. In 1752, Christian Froehlich makes a point to visit the forges near Bethlehem where the production of iron necessitated large amounts of timber to be felled and a plentiful supply of freshwater close to the source of the iron ore. One contemporary visitor to the Durham Furnace where Joseph/Boston is working marvels at how efficient the forge is in production as all necessary raw materials are within a close distance from each other and no lengthy hauling is necessary.
For many historians of the Colonial mid-Atlantic iron industry the presence of enslaved Africans is a passing footnote, mentioned as part of the issues with the lack of a skilled and unskilled labor force to work in the industry. However, there is also evidence that the enslaved Africans, such as Joseph/Boston came from West African cultures where the production of iron had been an integral part of the social and economic culture of their societies for centuries. Where the production of iron was embedded in the traditional religions of the Igbo people from whom Andrew came, for example. There is evidence for iron production in West Africa since the 6th century, with major shrines around Ife to the god of iron “Ogun”. Within these traditional religions, the forge was considered to be a female space, to be worked only by a male forgemaster, although women were permitted to perform other tasks outside the forge. (http://www.metmuseum.org/toah/hd/iron/hd_iron.htm)
Thus the iron forges of the Delaware Valley were the location of high densities of African enslaved workers, and thus also one of the destinations of Andrew and Froehlich. In the scholarship on labor history in Pennsylvania in the colonial period, researchers have pointed out the problems ironmasters had in keeping white workers in the forges. Pay, hard work and tough conditions coupled with the distance from urban centers all meant that free labor moved away from iron centers quickly. Thus forge owners such as William Allen looked to their enslaved workers to produce iron. However, although earlier scholarship assumed that enslaved Africans would be forced to perform the hard and unskilled labor of extracting and preparing the raw materials, more recent research into the Delaware Valley iron industry draws a contrast with the more southerly Chesapeake iron production industry. In the Delaware Valley ironmasters trained their African workers to refine and draw iron in their forges, to the point, as John Bezis-Selfa argues “that slaves were disproportionately represented among forgemen.” (J. Bezis-Selfa, 277) The presence of so many highly skilled African forgemen has led to speculation that African metallurgical skills played a large role in this phenomenon. Indeed this is another instance of knowledge transfer from Africa to North America.
Looking at the map of West Africa again, this time with the identification of sites of iron making, we see the correlation with Andrew and Joseph’s origins.
Iron had been worked in West Africa since at least 500 CE and European travellers in Africa such as Mungo Park noted the smiths there used tools and methods similar to those in British North America. It is also not lost on me that Bethlehem was to become the site of the largest blast furnaces in the country.
Investigation into Andrew as a paradigmatic figure for the diverse voices in early Bethlehem and Nazareth is a vital step towards asking further questions. There is by some the assumption that slaves would only perform menial forced labor, both in the congregation and outside. But to claim that is to prolong the prejudiced assumption that Africans could only perform menial tasks and brought with them no skilled knowledge from their homelands. That, I argue is an error.
The Helpers Conference minutes show lengthy and in depth discussions about the best way to ensure that EVERY member of the congregation could fulfill God’s (and the Congregation’s) “Plan” for them. Subject to the way in which the Lot decided, like every other member of the Congregation, Africans worked in Bethlehem in the colonial industries, trades, and choir houses. BUT they could also become instrument makers and preachers. They could hold firearms during times of trouble. They were also educated and valued for their national knowledge. Hence Andrew’s “Plan, after baptism, to be Christian Froehlich’s Helper and preach to his “Landsleute”.
Single Brethren’s Diary, 1744-1752, Moravian Archives, Bethlehem
Box marked Slaves, Moravian Archives, Bethlehem
Travel Diary, Christian Froehlich, 1752
Travel Diary, Christian Froehlich, 1744
Secondary sources
John Bezis-Selfa, “Slavery and the Disciplining of Free Labor in the Colonial Mid-Atlantic Iron Industry” Pennsylvania History 64 (1997) 270-286
Arthur Cecil Bining, Pennsylvania Iron Manufacture in the Eighteenth Century (PHMC, 1973)
John Catron, “Early Black-Atlantic Christianity in the Middle Colonies: Social Mobility and Race in Moravian Bethlehem” Pennsylvania History 76.3 (2009), 301-345
Katherine Faull, ““Self-Encounters: Two Eighteenth-Century African Memoirs from Moravian Bethlehem” in Crosscurrents: African-Americans, Africa and Germany in the Modern World, eds. C. Aisha Blackshire-Belay, Leroy Hopkins, and David MacBride (New York: Camden House, 1998), 29-52; reprinted in Michael J. Drexler and Ed White, Beyond Douglass: New Perspectives on Early African-American Literature, Aperçus: Histories Texts Cultures. Lewisburg: Bucknell University Press, 2008
Michael Kennedy, “Working Agreements: The Use of Sub-Contracting in the Pennsylvania Iron Industry 1725-1789” Pennsylvania History 65.4 (1998), 492-508
Anne Kelly Knowles, Mastering Iron: The Struggle to Modernize an American Industry 1800-1868 (University of Chicago Press, 2013)
Theodore Kury, “Labor and the Charcoal Iron Industry: The New Jersey-New York Experience” Material Culture 25:3 (1993), 10-33.
Jill Lepore, New York Burning: LIberty, Slavery, and Conspiracy in Eighteenth-Century Manhattan (Random House, 2005)
Joseph Levering, A History of Bethlehem, Pennsylvania 1741-1892 (Times Publishing, 1903)
Ronald Lewis, “Slavery on Chesapeake Iron Plantations Before the American Revolution” 59.3 (1974), 242-254
Harry Stocker, A History of the Moravian Church in New York City, New York City, 1922
John Thornton, A Cultural History of the Atlantic World 1250-1820 (Cambridge UP, 2012)
Joseph Walker, “Negro Labor in the Charcoal Iron Industry of Southeastern Pennsylvania” The Pennsylvania Magazine of History and Biography 93.4 (1969), 466-486
Yesterday I fulfilled a desire, harbored for all the years I have been working on the Susquehanna River; and that was to travel as far south as I could to the mouth of the Chesapeake Bay. It took a lot of driving and navigating, but I did it.
This desire was not merely a romantic wish to experience the river from source to bay (which now I have done, albeit not always in a kayak). I was stunned at the changes the river goes through, from its modest beginnings up in Cooperstown; its torments at the hands of the post-industrial towns of Binghamton and Wilkes Barre; its majesty on the North Branch as it winds its way through the mountains, steep wooded ridges rising on both sides and monitored by high soaring eagles; the calmer waters as it joins with the West Branch at Sunbury and provides the motorist on route 15 with a most glorious companion with its wide stretches, and myriad wooded, farmed, and rocky islands, that reminded one Moravian missionary of a city with its avenues and cross streets. And then finally, the transformation of a river into a series of lakes, some over 200 feet deep, formed behind the hydro-electric dams of Safe Harbor, Holtwood and Conowingo.
Standing at Fisherman’s Park on the spillway below the Conowingo Dam.
It is late summer and the river is low. From the main branch down to Wrightsville, the bed rock is visible, jutting up over the surface to make riffles that would please any kayaker and exposing the ledges in the river bed. The water is warm, maybe too warm for the fish to enjoy and thus the eagles hunt elsewhere. But below the last dam, at the spillway of the Conowingo, this wide full river is a trickle, meandering like an afterthought through the rocks. Its banks bustling with anglers and birders, this final stage of the river seems on an August afternoon weary of its 444 mile journey to the sea, almost succumbing to defeat at the hands of human industry. As I looked downriver all that was visible were the final metal bridges crisscrossing the viewscape before you get to the Bay. An ignominious end.
I had a very pragmatic need to make this journey yesterday. I am in the final stages of compiling a report for the National Park Service on the Indigenous Cultural Landscape of the Lower Susquehanna. As part of the segment planning process, I am heading up a team of scholars and mappers to make an argument to the NPS for certain landscapes of the Susquehanna to be designated as “evocative of the natural and cultural resources supporting American Indian lifeways and settlement patterns in the early 17th century.” (See http://www.nps.gov/chba/learn/news/indigenous-cultural-landscapes.htm) These landscapes are also important to descendant communities today, and are intended to aid conservation strategies in the Chesapeake and its watershed. This has not been an easy process. As this approach to understanding large landscapes is still in the development stage, it has not always been clear how to describe an “Indigenous Cultural Landscape” without succumbing to the romanticization of an indigenous viewpoint, without projecting the settler culture’s desire for a “edenic” past (to quote my colleague and collaborator, Alf Siewers). And indeed, the displacement and genocide of the Native populations of Pennsylvania means that those descendant people are probably radically dislocated from these landscapes. Unlike Virginia or Maryland or New Jersey, Pennsylvania is one of only two states left in the Union that does not recognize the presence of Native nations in its borders. Thus, the very notion of a Native heritage landscape is thoroughly disrupted. And unlike the PI’s in other Indigenous Cultural Landscape studies (as on the Nanticoke river) I can’t go to the recognized American Indian nations and ask, “What does this place mean to you?” because they are elsewhere.
The vast amount of work that has been completed by my colleagues and our students on the history and culture of the Susquehanna River under the umbrella of the “Stories of the Susquehanna” is crucial to the rebuilding of Native American connections to the landscapes that were left behind. Through outreach to the Haudenosaunee, facilitated by Sid Jamieson, and public history events, such as the North Branch Heritage Kayak sojourns, organized by David Buck of Endless Mountains Outfitters, bonds are being rebuilt between the landscapes of the Susquehanna and the descendants of those people who populated them, hundreds of years ago. And there are those, like Onondago Canoe Club owner, Hickory Edwards, whose mission it is to “reindigenize” the river. Paddling the length of the Susquehanna last year, down to Annapolis and then walking on to Washington DC to the opening of “Nation to Nation” exhibition of treaties at the Museum of the American Indian, Hickory might exemplify a Native view of Indigenous Cultural Landscapes. They are being rediscovered, like a newly revitalized part of the body, awakened after centuries of numbness.
The guidelines for creating an ICL make it clear that the importance of landscapes to descendant communities today is central. But my question is, who is the audience or viewer of the landscape? Yesterday, as I paused for a meeting at the Zimmerman Heritage Center on Long Level, I was thrilled to see the progress that had been made there in creating interpretive materials for the passing public. A stylish jetty on the waterfront has been built, shaded by a sloping roof and lined with benches wide enough to provide work space for me and my computer and my collaborators. In front of us, a full size replica of Benjamin Latrobe’s glorious survey of the Lower Susquehanna, commissioned by the Pennsylvania State legislature for the “improvement” of the river from Columbia down to the head of the Bay, is displayed, revealing a water viewscape radically different from that which confronts today’s visitors who can read, “Latrobe’s Susquehanna survey represents a rare profile of the physical features of a region just beginning to feel the impact of agricultural and commercial development.” As true as this is, the view across the river, now a lake, also points us in the direction of Washington Boro, the site of dense Native American settlement and horticulture/agriculture during the timeframe delineated by the requirements of the Indigenous Cultural Landscape initiative. Benjamin Latrobe’s survey certainly gives the viewer an idea of the radical change in the river thanks to the hydroelectric dams of 20th century energy production, but what it does not tell us is that this was a center of trade, exchange, agriculture and human interaction with the environment for hundreds of years prior to his “clearing” or dynamiting of a channel up the river. This part of the story is told behind the viewer. Turn around and climb the escarpment and you will find the “Native Lands County Park”, which at my last visit to this place was just an idea. Now the visitor can learn about the last known village of the Susquehannock Indians that stood on top of this hill (1676-1680) (the Byrd Leibhart site) where once 3,000 people lived in a stockaded four acre village in 16 ninety foot longhouses. The view from this hilltop reveals the wide sky, water and rolling hills of the Piedmont, now punctuated with wind turbines and McMansions. But the sense of this landscape is strong enough to blot out those intrusions of 21st century America (for now).
Even with the deep knowledge I have of this landscape, its history of human settlement and conflict, its soils, its elevation, its climate, its cultivation, I cannot see it through Native eyes. And I should not. If all that this initiative does is to deepen the settler culture’s understanding of the place on which it stands and builds and dynamites and dams, then I think much will have been achieved. However, within the borders of Pennsylvania’s bastion of historical denial, within this state of willed and legislated amnesia, we are a very long way from reindigenizing our landscapes.
I am re-posting on my personal site my blog entry for my class site for The Humanities Now! These are questions that I have been thinking about a lot, and my reading of Johanna Drucker’s Graphesis has really helped to crystallize my ideas. I am so happy that she will be coming to Bucknell in April of 2015 as part of our Humanities Institute on the Digital Humanities.
Over the last week or so, we have revisited visualization as a technique for interpretation. In our production of networks using Gephi, the process of creating data, preparing it for input into the software, manipulating it once in the software and then interpreting it once entered has been foremost. As we move on to mapping, we will find parallel processes at work: preparing data, entering it, manipulating it, interpreting it. And as we do so, it behooves us to think critically about what we are doing, and what we are not doing.
Johanna Drucker’s intelligent, broad view of visualization as a form of knowledge production offers us many pointers for taking each step on our path to visualization and interpretation with deliberation. The long chapter “Interpreting Visualization–Visualization Interpretation” from her book, Graphesis: Visual Forms of Knowledge Production (Harvard, 2014) presents us with an overview of forms of visualization primarily since the Renaissance, and it also issues a plea for the development of a greater understanding of the force of visual rhetoric; a plea that is directed especially at humanists, as they enter into a realm of spatialized representation that might appear to belong to the realm of the quantitative over the qualitative.
Visualizations can be either representations or knowledge generators in which the spatialization or arrangement of elements is meaningful. When reading a visualization, Drucker encourages us to use language carefully, employing terms such as “juxtapose”, “hierarchy”, “proximity”. Drucker claims that visualization exploded onto the intellectual scene at the edge of the late Renaissance and beginning of the early Enlightenment, when engraving technologies were able to produce epistemologically stunning diagrams that both described and also produced knowledge. Now with the advent of digital means to manipulate and produce data we can all produce timelines (!) without giving a thought to the revolution in the conceptualization of time and history that (our near neighbor) Joseph Priestley occasioned. So, as we play with Timemapper or Timeglider, Drucker cautions us to become aware of the visual force of such digital generations. “The challenge is to break the literalism of representational strategies and engage with innovations in interpretive and inferential modes that augment human cognition.” (p. 71)
How do we do this? Drucker argues for us to recognize three basic principles of visualization, both as producers and as interpreters: a) the rationalization of a surface; b) the distinction of figure and ground; c) the delimitation of the domain of visual elements so that they function as a relational system.
In her sections on the most prevalent forms of visualization, I find most pertinent to the coming module on mapping her insight that a graphical scheme through which we relate to the phenomenal world structures our experience of it (p. 74). In other words, the mapping of the earth, sky, sea or the measurement of time, that are in themselves complex reifications of schematic knowledge, actually become the way in which we experience that thing. The week is seven days long and the month is 28-31 days long (because of lunar cycles) and thus astronomical tables become the way we structure time. But time isn’t like that; it isn’t linear, especially in the humanities! It contains flashbacks, memories, foreshadowings, relativities (it speeds up when we are nervous, and slows down when we are scared). So we are imposing structures from social and natural sciences onto human experience. Drucker argues that the shape of temporality is a reflection of beliefs and not standard metrics, and therefore asks how do we find a graphical means to inscribe the subjective experience of temporality or the spatial?
For example, digital mapping may give us the ability to georectify a manuscript map onto a coordinate system, but what does this give us? It might show us how accurate a mapmaker was, or was not; it might help us to locate an archaeological site with more probability, but it is ignoring the fact that the manuscript map, drawn perhaps on buckskin, or stone, or vellum is a representation (and a thin one at that) of a traveler’s or observer’s experience that we are then translating into a system of coordinates. What is absent is the story; way-finding depends upon narratives, travel accounts, diaries. We must be aware that maps produce the illusion of isomorphism, but this illusion is based on an elaborate system of abstract schema and concrete reality.
I am most captivated by the section of her chapter that focuses on visualizing uncertainty and interpretive cartography, as this is an area I have thought a lot about in the last five years during which I have been working with GIS. As a software, GIS gives us enormous power to produce knowledge as a generator; through the combinatory power of layers, and base maps, and points, and embedded data tables, GIS has often seduced me with its “deceptive naturalism of maps and bar charts” generated from spreadsheets that I and my students have spent months creating. It strengthens the fiction of observer-independence; the objectivity of the “bird’s eye view”, and, as Drucker so aptly states, “we rush to suspend critical judgment in visualization.” For me, however, and for the students I have worked with, the question of how to represent ambiguity has consumed us; as has also how to make ambiguity the ground of representation. I think here of the brilliant visualizations of Steffany Meredyk, ’14 as she created her interpretive map of the main stem of the Susquehanna River.
Steffany Meredyk’s map of the Susquehanna River
Using the work of Margaret Pearce, Steffany and I talked for long hours about the importance of reinserting the positionality of the observer into the visualizations of the river. Taking her “data” from accounts of massacres in the 1760-80s that occurred on the Susquehanna River, and using graphical means of Adobe Illustrator to represent ambiguity, uncertainty and emotion, I consider Steffany’s work to act as a model for the way in which we can use digital media and methods as humanists. We can, as Drucker observes, “model phenomenological experience; model discourse fields; model narratives and model interpretation.”
Kayaking is not just a sport to Hickory Edwards of the Onondaga Nation. It is his way of reviving his nation’s knowledge about its own history and the environment, and also raising public awareness about the ties of the Haudenosaunee to the land. This summer, the coordinator of the Onondaga Kayak and Canoe club decided to retrace the steps and paddle strokes of his forebears by kayaking first from Buffalo, New York along the Tioughioga to the Chenango river to Onondaga on a trip that became known as “The Journey to the Central Fire” to recognize Onondaga’s central position in the “Long House” of the Six Nations. While attending the annual four-day reading of the Haudenosaunee’s “Great Law of Peace” Edwards listened to the words that had been recited so many times about the planting of the Tree of Peace that had brought unity and concord to the then five warring nations of the Iroquois. Seeing that tree in his mind’s eye, Edwards realized that its spreading white roots were actually routes of peace, traditional waterways that spread out from the center of the Haudenosaunee world, waterways that would take him to the sea in whatever direction of the compass he chose to go.
He decided to go south, down the Susquehanna River to the Chesapeake Bay and from there on to Washington DC. “We wanted to take our message from the capitol of the Haudenosaunee to the capitol of the US,” he said in a recent interview from his home near Syracuse, NY. And what is that message? “We are still here. The Native people and their trade routes and waterways are not forgotten. We need to remember our language and our lands. We need to re-indigenize the river.” The goal of this epic human-powered journey was the National Museum of the American Indian on the capitol’s Mall where an exhibition opened on September 21, 2014, “Nation to Nation,” that celebrates the historic treaties drawn up between the Native nations and the colonial governments. “The treaties are still valid,” said Edwards “so we decided to go see them.”
Edwards carrying the Haudenosaunee flag to the National Museum of the American Indian
Although prepared to paddle over 500 miles alone, Hickory Edwards could not help but attract support from wherever he went. Joined five days into the journey by fellow kayaker, Noah Onheda and supported the whole way down by his parents acting as ground crew, Edwards described the highlights of the trip down the Susquehanna. For example, standing at Indian Rocks just north of Wyalusing, where Handsome Lake, religious leader of the Six Nations in the late 1700s contemplated the spiritual future of his people. Or the petroglyphs at Safe Harbor that represent powerful, ancient things, carved into what looks like a little Turtle Island in the river. “This is what we must do,” said Edwards “relearn the waterways of our peoples to know where these places are.” Following what he called the “white route of peace” south, Edwards claimed they never had one bad night. “The water was good to us all the way down.” Well, except the very last day, when the winds on the Chesapeake Bay picked up and the waves rose so high around the kayaks that Edwards lost sight of his paddling companion Noah for the height of the water. “Maybe the waves didn’t want us on the water that last day,” Edwards mused. Despite the wind and tide and waves, they made it to Sandy Point State Park, just outside Annapolis, Maryland where they were greeted by representatives of the National Park Service, Deanna Beacham and Suzanne Copping, and treated to a meal, big enough to sate any epic paddler’s appetite!
Having not really used their legs for nearly three weeks, walking over 30 miles from Annapolis to Washington DC was no easy feat. But, they did it. Arriving at the nation’s Mall and the NMAI was a historic moment, with the Haudenosaunee flag flying high. “We did it,” he said, “we came from our capital to yours to see the historic treaties.” And they had even brought water from the spring on the Onondaga Nation land to water the tobacco plants in front of the museum.
Edwards and his father and co-paddler, Noah Onheda examine the treaties made from Nation to Nation at the NMAI exhibit that opened September 21, 2014
Now back home for almost the first time this summer, Hickory Edwards is already planning his next big trip. From kayak races on the Onondaga creek, to a Peacemakers’ journey, to joining the Two Row on the Grand River in Canada next summer, Edwards paddles to revitalize our awareness that clean water is important. “The circle of life starts out with the next generation looking up at us from the earth,” he explained. “They grow and live and return to the earth. But there is one constant throughout, and that is water. Waterways are the veins of our Mother Earth.”
And it is along those life-giving waterways that Hickory Edwards will continue his personal quest.
The Principal Investigators of the Stories of the Susquehanna initiative are pleased to announce the launch of the “crowd sourcing” platform for the river. As a public humanities project, the Stories of the Susquehanna initiative invites members of the public to submit their Stories of the Susquehanna for possible inclusion. If you have a story about the cultural, historical, or environmental significance of the place where you live in along the Susquehanna River, we’d love to hear from you! What’s your story?
Since its inception, Stories of the Susquehanna has been a collaborative, interdisciplinary digital project that has at its core a geospatial interface. What started out as historical/cultural mapping of the Native American landscapes of the Susquehanna in ArcMap Desktop with maps published in static image format (as discussed in the interviews of me and Emily Bitely) has evolved through the iterations of ESRI’s software development.
About a week ago, one of our Digital Scholarship Coordinators and SSV project manager, Diane Jakacki pointed to to the fact that ESRI was now publishing apps. At first skeptical, I proceeded to delve further into the Collector app and battled my way through tutorials designed for insurance adjusters gathering data in the field (no, I don’t need fields labeled “Habitable” or “Partially Destroyed”) to create a feature layer that could be added to any map in ArcMap online. This feature layer was supposed to be able to both locate you in the field and allow you to input field data in real time at the same time as giving you access to the rich data associated with points and lines in pop-ups. The new feature layer could also permit the attachment of photos and video.
My co-PI, Alf Siewers and I had been discussing over the last few months how we could best create this kind of mobile interface and had been in long discussions with both Diane and Andy Famiglietti as to how this might happen. This app seemed to me to offer us a ready made way to send our students out into the field to collect data, upload it, and also see it within the context of the historical information that had already been collected.
Add Feature window showing the fields and photo upload option
After some tussling with an outdated version of ArcMap (10.0 vs. 10.2) and successfully navigating our excellent ArcMap Online resources, I was able to author and upload a prototype of a multi-layered interactive map of the Susquehanna watershed that had the mobile features I wanted (well, almost). However, one field caused the app to crash repeatedly and I knew I had to re-author it in Desktop.
Enter my Presidential Fellow, Steffany Meredyk. Today, as almost a final collaborative act after four years of working together, Steffany and I worked out the problem; now we can test out an interactive crowdsourcing feature layer for online maps of the Susquehanna this weekend on the North Branch Kayaking Sojourn. Whoops of joy were detectable…. but not uploaded…
The Collector app has a rich potential for data gathering in the field. Whether to record information on bird populations, the state of repair of the rail-trail, tracking plant coverage, or encouraging crowdsourcing of local history, this is an exciting and versatile digital step forward in our work of bringing the Stories of the Susquehanna alive.
How do you represent visually relationships between people and places that are, I have discovered, unmappable. Only in this last week, under the gun of a deadline thrice removed, did I finally realize that this is what I have been trying to do. Still working on a chapter for a book on Pennsylvania’s Babel of the 18th century, I needed to find a way to describe the dynamic and complex way in which not only Native peoples but Moravians, men and women, communicated and travelled in mid-18th century Pennsylvania. This is an important realization as, within the traditional historiography of this period, both Native and Euro women were just elided. More recently, the focus has turned to Native women in in terms of their agency and mobility. However, what I have been wanting to discuss is how a group of women who were active as missionaries in the Moravian mission field of the 18th century brought with them their expertise from either Europe or the early settlements in New York State and Pennsylvania to effect a translation of culture and knowledge here on the Susquehanna River.
The source materials I have been working with for this chapter are predominantly unpublished, or, if published, reside in 18th century Fraktur imprints. Seemingly straightforward questions, such as birth dates and places, require lengthy investigations of manuscript sources or typed up lists of information taken from the Geburts- und Tauf Register of the Bethlehem communty (also unpublished) or other missions. Spreadsheets of names, dates, places that I have put together over the years have helped in these investigations. And in this quest I was to find out that this accounting of data over the last 25 years would help more than I could have imagined.
I have wanted to map the way in which these women lived and worked (in German I would use the verb “agieren”) in the mid-Atlantic. I wanted to show how their lived lives became an integral part of the warp and weft of the environment of the Pennsylvania backcountry. But to do that I had to also delve into why they were here, what brought them to this place at this time? How did they translate the skills, experiences, concepts of self that had been learned in the Pfalz, Germany, or a village near Oxford, England, or a farm close by the Mohican villages in upstate New York to the banks of the Susquehanna or the Lehigh rivers?
I started to make maps. Firing up my GIS layers, I mapped the missions, I mapped the women, I inserted date ranges. But it still was static. It didn’t show the movements of the women between the missions over time in an effective way (maybe because I am not as skillful at this as my students…) Then, staring at the DH Humanities list from my alma mater King’s College, London, I saw the announcement of palladio in beta out of Stanford. Assuming that this was a happy by-product of the well-known and ground-breaking project “Mapping the Republic of Letters” I decided to “dive in.”
When I first started working on the Moravian women’s memoirs 25 years ago I was surprisingly data driven. I wanted to know who these fascinating and diverse people were. One of the places in Bethlehem that inspired me to work on the Pietist group was the “Gottesacker” with its flat gravestones that are ordered in terms of marital status, age and gender and not by social ranking or racial group. I found the register of the Gottesacker and built a database of all the women who were buried there, found information about their birthplace, dates, brief biographies. When I looked at how data was supposed to be entered into Palladio, I thought this would be a good first project. With the help of my research assistant, Hein Thun, we entered all the exact locations of birth and death in longitude and latitude and then I entered this into the online program. What came out was good. A mapping of places from which the Bethlehem women came in the 18th century, both in terms of a geo-location and also a very basic visualization.
First visualization in Palladio of Moravian women’s birth places
Initial Palladio mapping of Moravian women’s birth places
Having had some success with this visualization I wanted to try it with the missions and missionary women. But I couldn’t get it to show what I wanted. I was still too hung up on mappy maps.
It wasn’t until I talked to Andy Famiglietti, one of the Digital Scholarship co-ordinators at Bucknell, that I realized that I had to think of maps that weren’t maps. I had to remove the “geo” from my spatial thinking to visualize these relationships. This was not easy for me; really, really not easy. I had tried working with Gephi before, but it was only once Andy explained to me the fundamental rule of thinking about networks as relationships between two entities (not three, not four) that I understood why my attempts to date had failed. So, modifying the data, stripping it down to the “edges” of people and places, we were able to visualize what I had been looking for and trying to express in my chapter.
Gephi produced network analysis of relations between Moravian women missionaries in the mid-Atlantic
It was truly a “eureka” moment. Yes, it is not the most elegant, or beautifully rendered visualization. But it showed what I wanted it to show, the strength of relationships between these women and their places of agency.
Curious to see how Palladio might represent this same data I fiddled around that night and came up with another, different, visualization of these people and places.
Using Palladio to visualize relations between Moravian women and mission place
Again, it is not beautiful and I have not fully explored the capacities of Palladio, but it is a beginning. A beginning of mapping without maps, of being able to render visible what has been invisible to date, namely, the strong network of women’s lives in the history of this place.

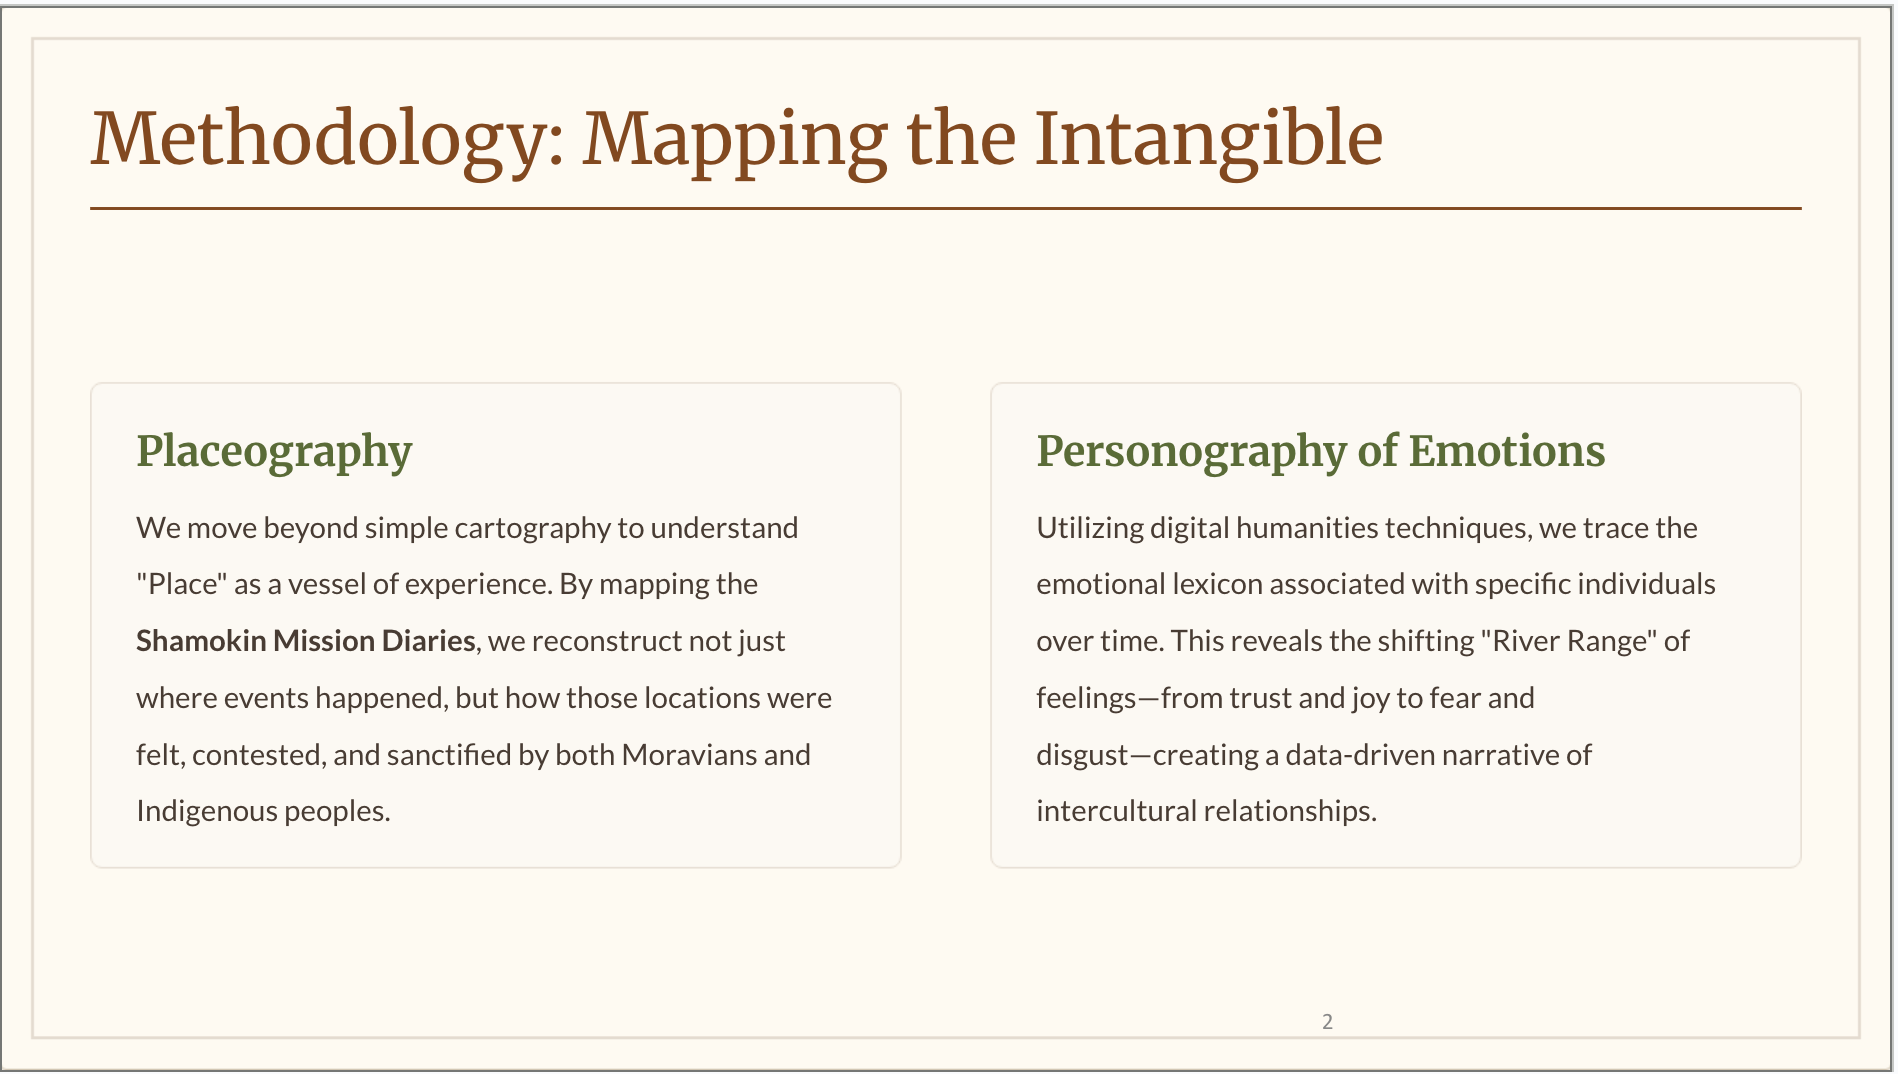
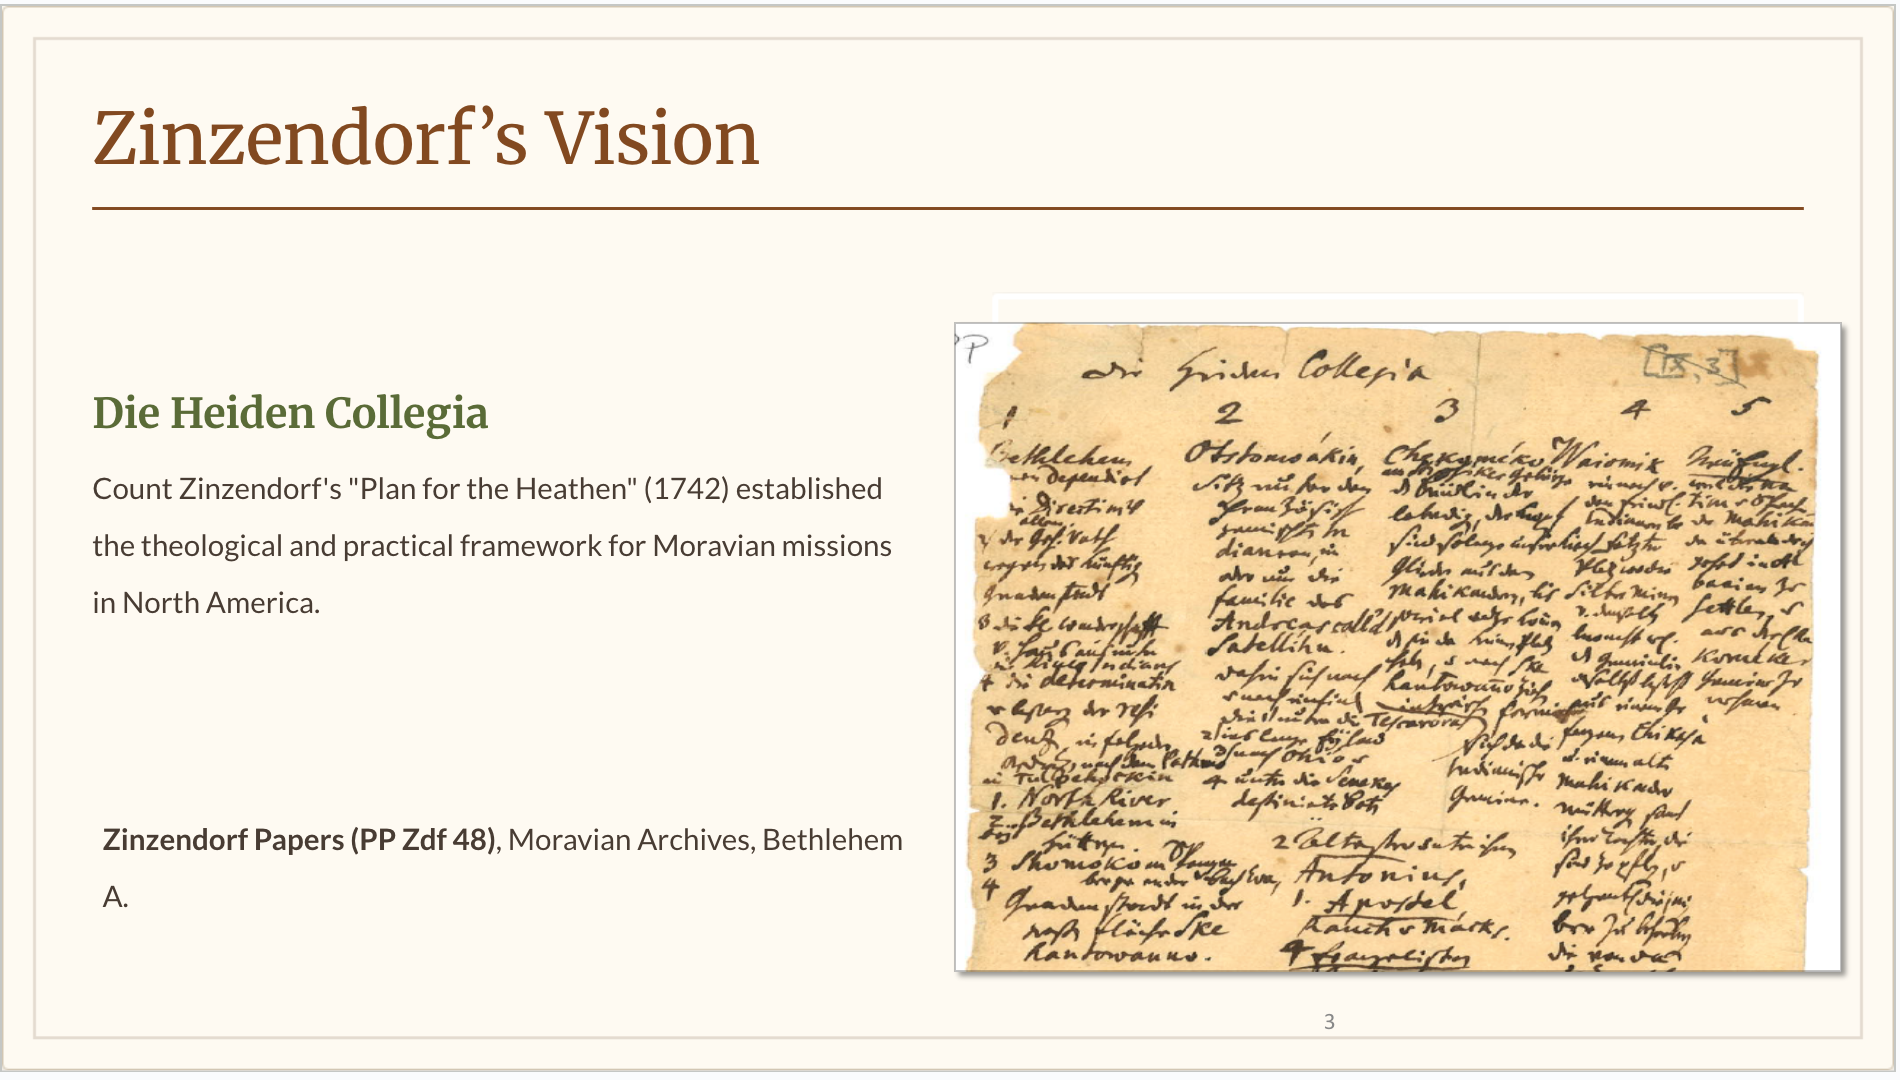


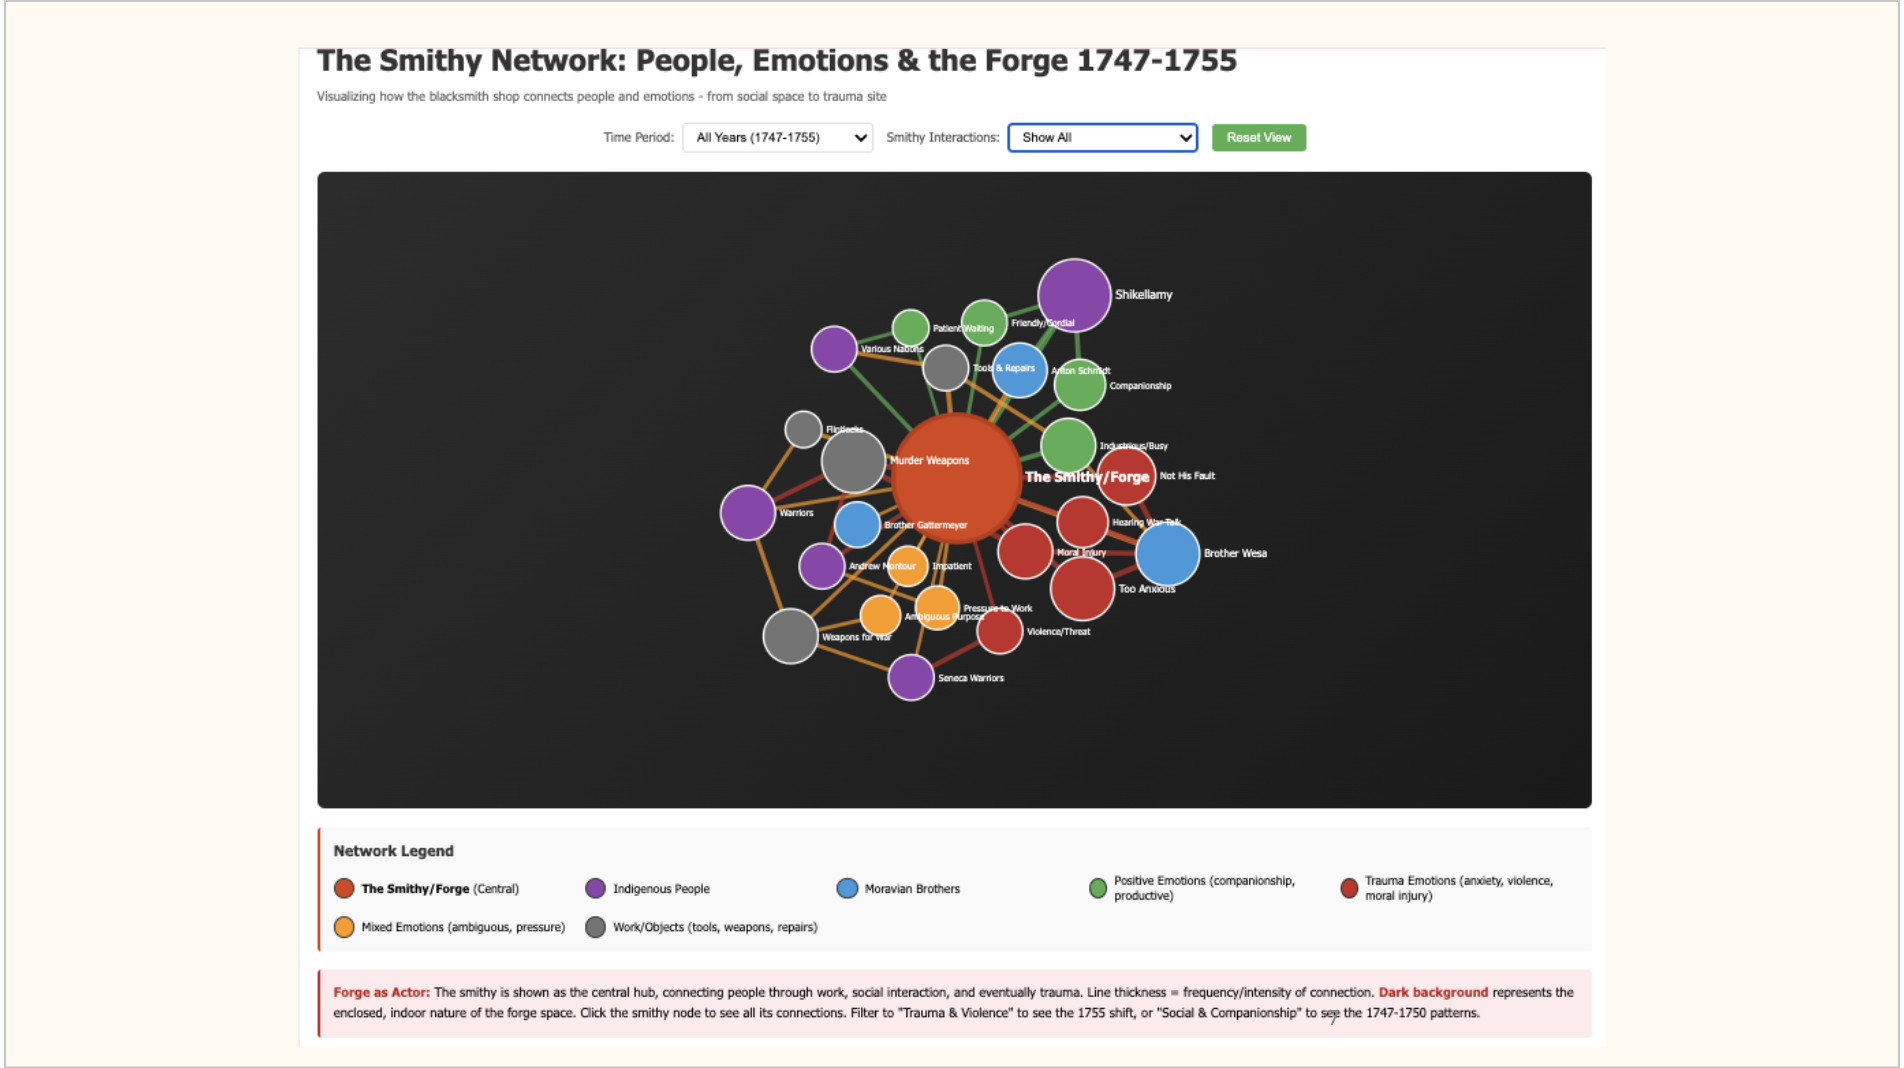

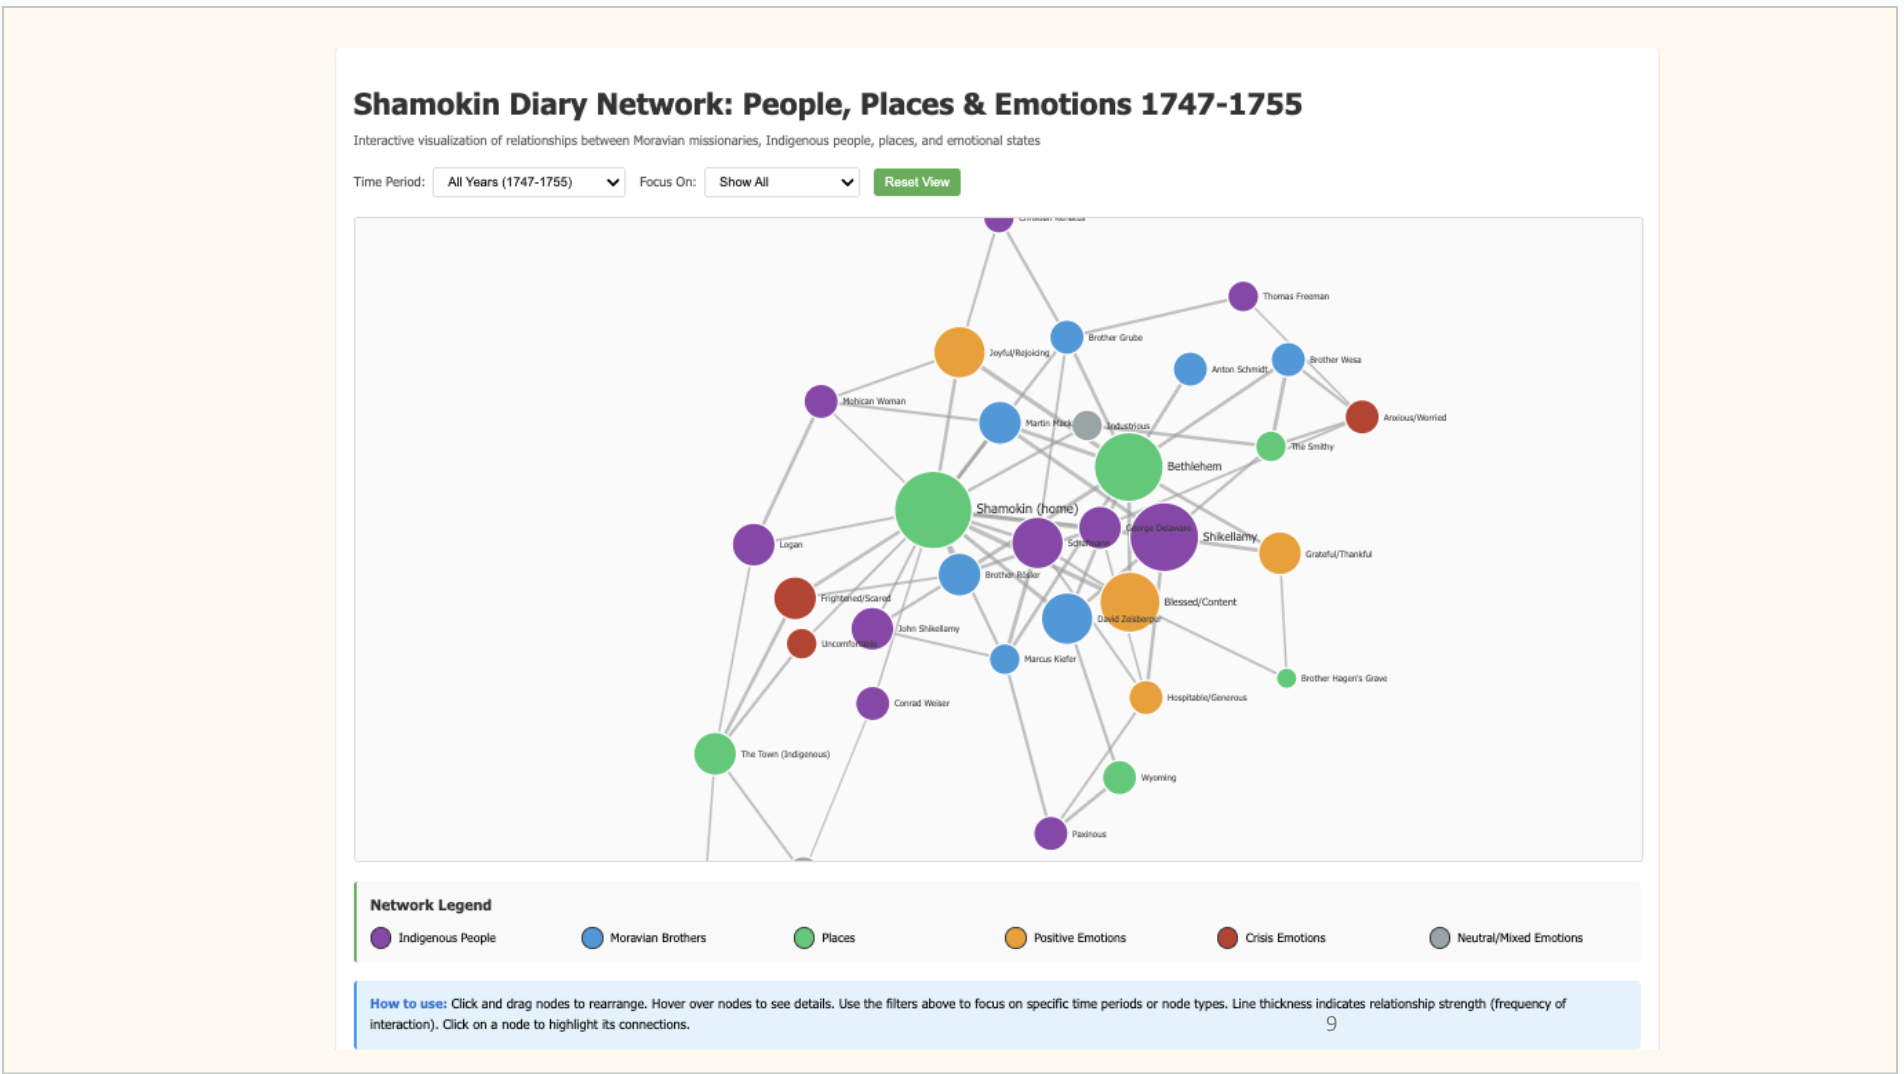

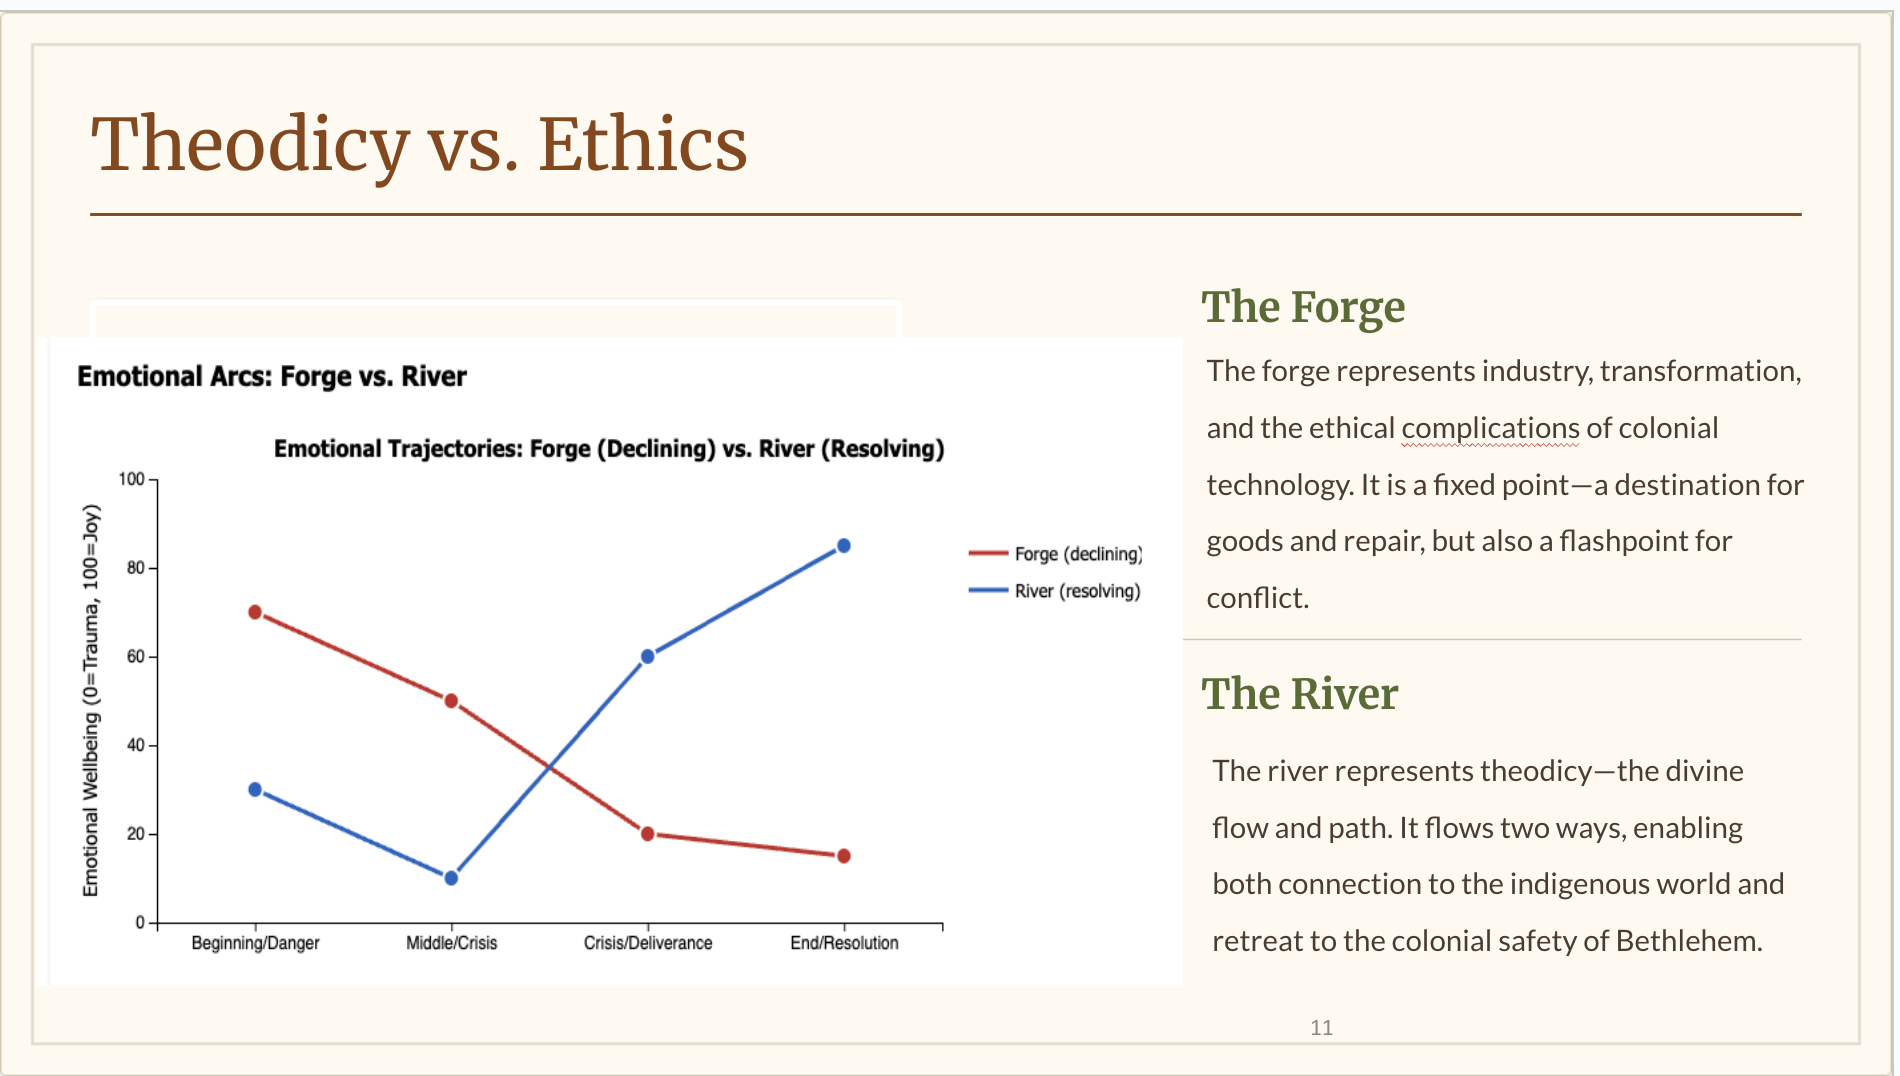
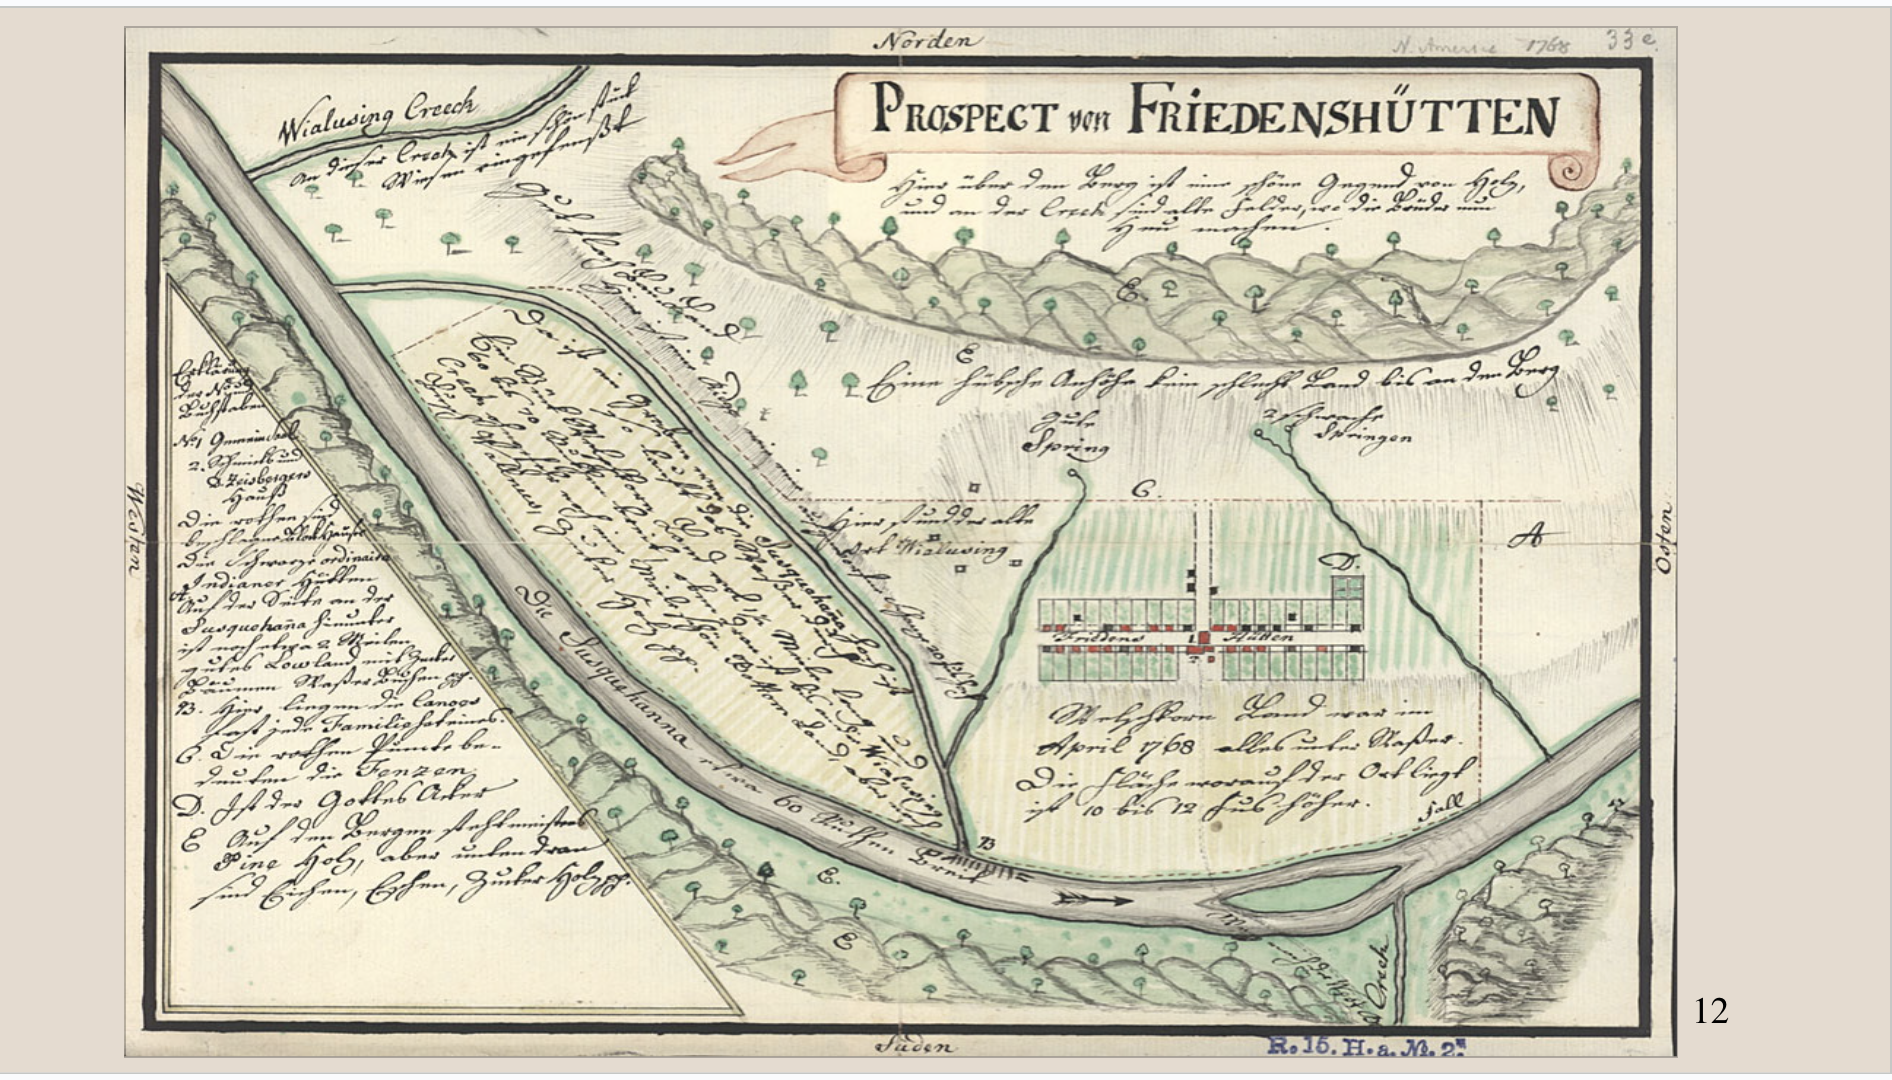


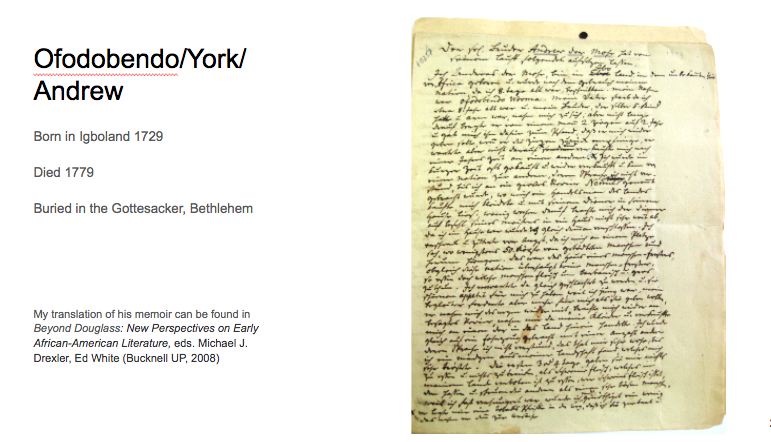
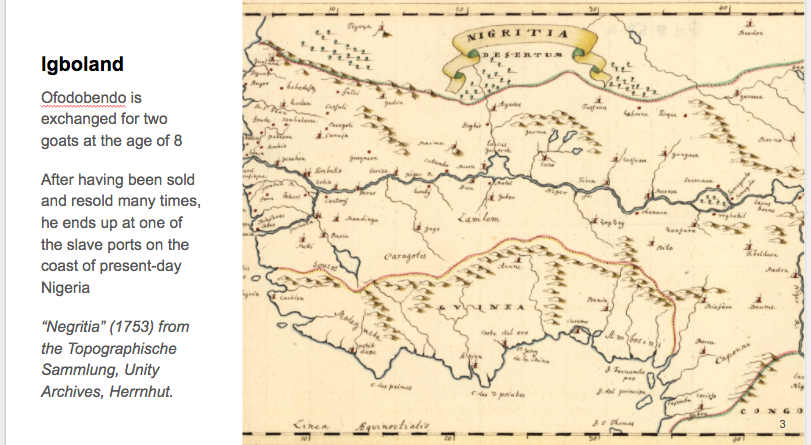
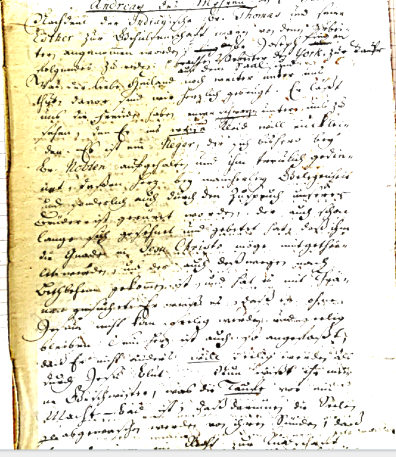
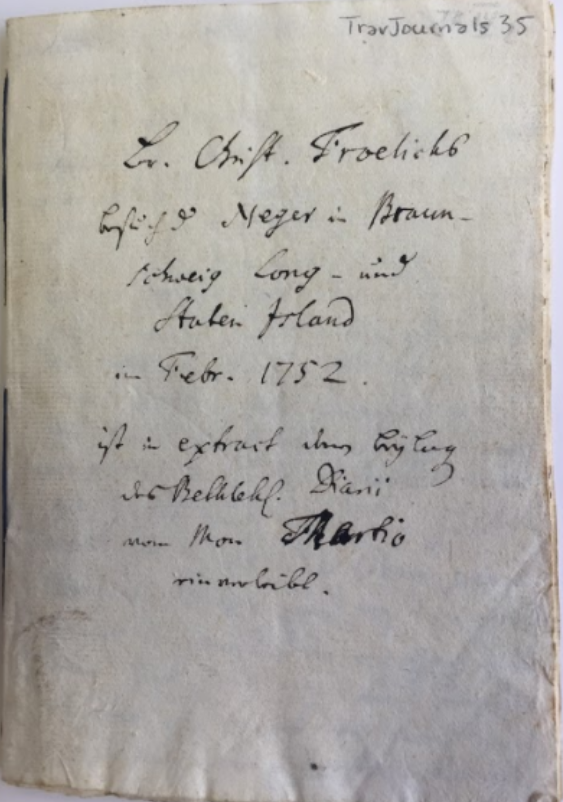
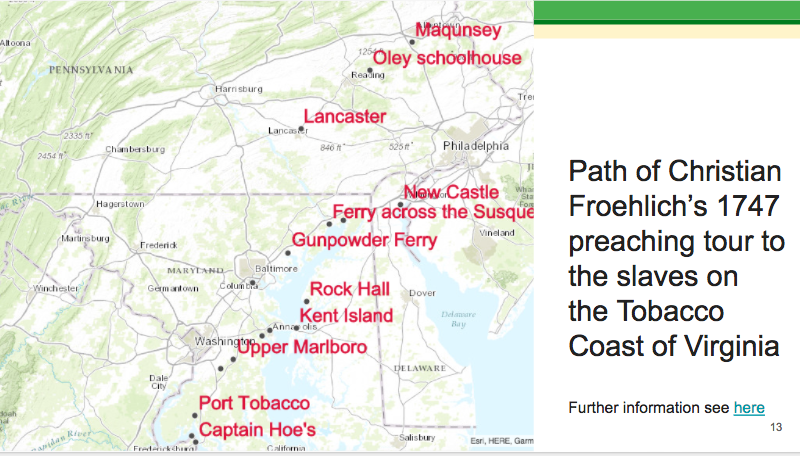
 This 1752 document, however, described Froehlich’s visit to the enslaved Africans of New Jersey and New York, a subject that within Moravian studies has hardly been touched at all. Where there are studies of race and religion, they are of the South and rarely mention the populations of Africans living in the mid-Atlantic. Froehlich’s first stop on his journey is to the “Eisen Schmelze” or iron foundry near Bethlehem, the Durham furnace, owned by Mr Wiliam Allen. H